AI Search Visibility Metrics: The KPIs an Agency Can Prove
Six AI search visibility KPIs with a stated numerator, denominator and minimum sample, each one traceable back to a stored answer - plus the three metrics we leave out of a client report on purpose, and why.
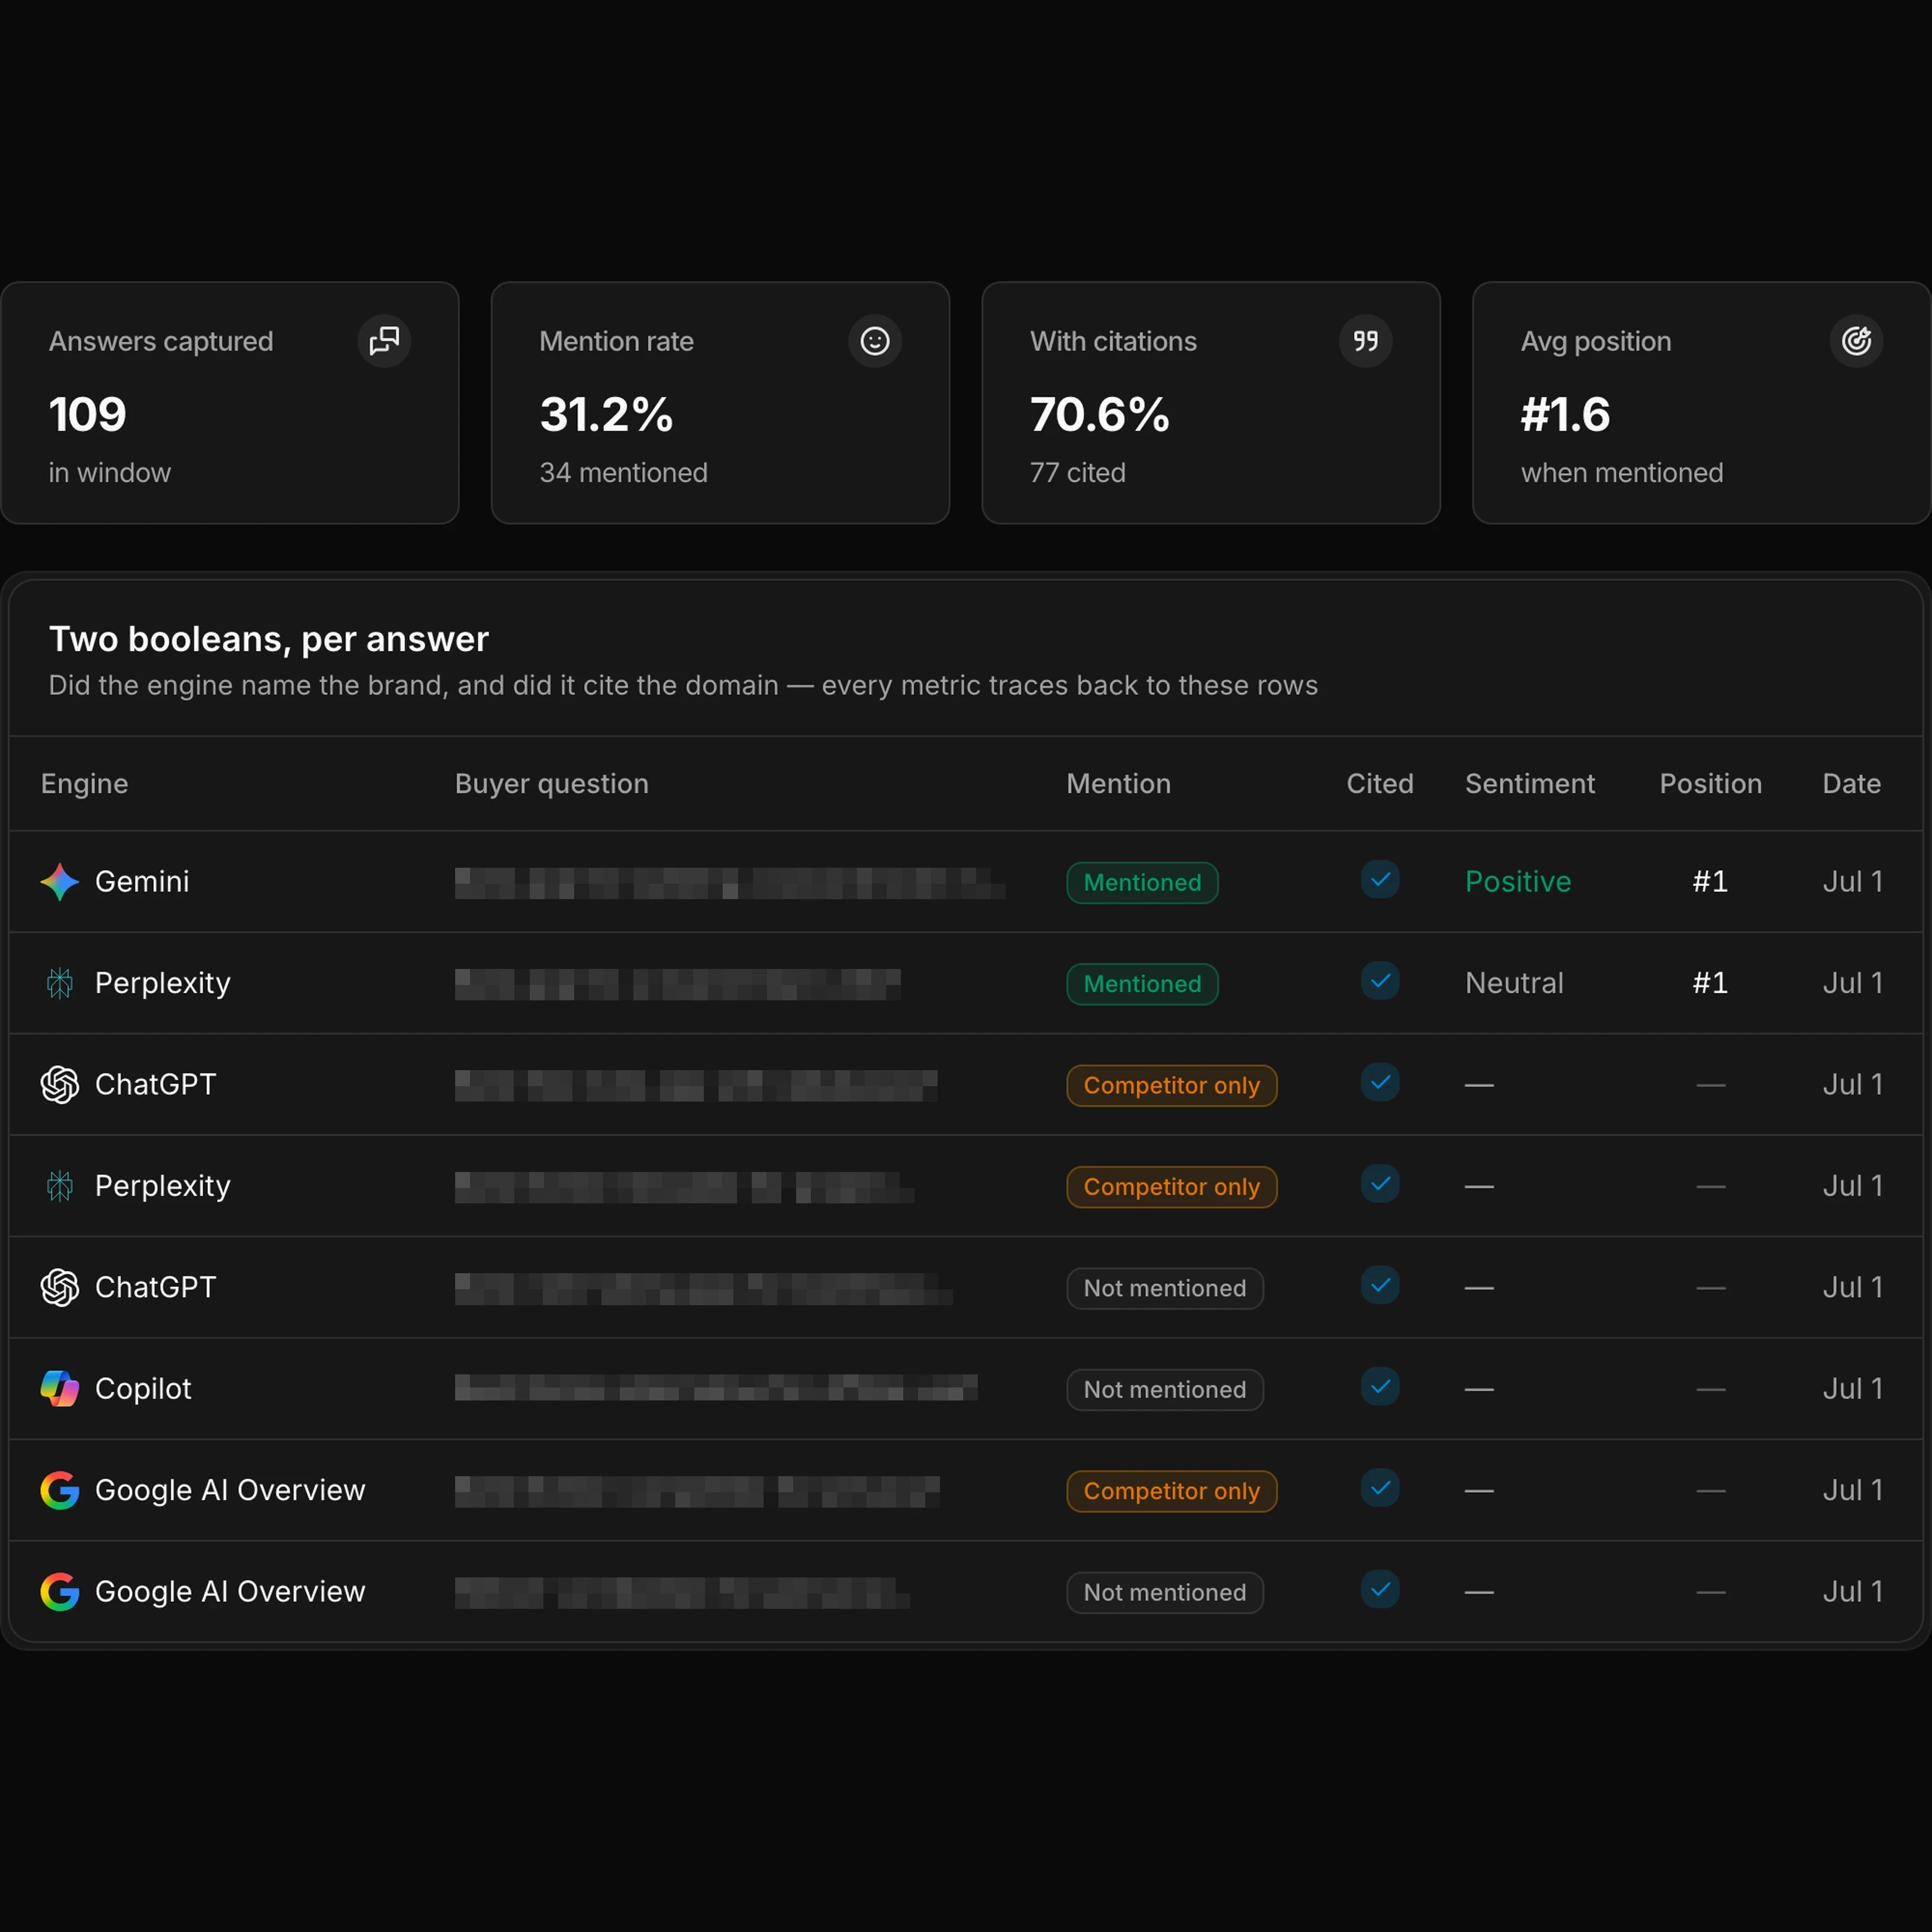
TL;DR: Most AI search visibility metrics KPIs lists name a metric and stop. A KPI is only reportable when three things are written down: what goes on top, what goes underneath, and the smallest denominator at which you are willing to print a percentage. Six outcome KPIs survive that test - mention rate, citation rate, conversion gap rate, source gap rate, prompt coverage, and share of named answers. All six are derived from two booleans per answer, and every one of them opens back to the answer text that produced it. We leave out position, sentiment and any composite score reported on its own, and the reasons are below.
Agencies do not get rejected in a client meeting for picking the wrong metric. They get rejected for not being able to say where the number came from when the client asks. So the useful question is not which AI visibility KPIs exist - every vendor publishes a list - but how to measure AI search performance in a way a client can re-derive from the material. That is a definition problem, not a tooling problem, and it is solvable on a Tuesday afternoon with a spreadsheet.
This page owns the metric definitions. For the two booleans underneath all of them, see mention vs citation. For the four quadrants they sort answers into, see the source gap vs conversion gap framework. For where these numbers sit inside a monthly deliverable, see SEO client reporting when AI answers eat clicks, which owns the report structure this page only feeds.
Outcome metrics and input metrics are not the same list
Published KPI lists mix two different kinds of number, and the mix is why they cannot be defended.
An outcome metric describes what an engine said. It is read off an answer that already exists: the brand was named or it was not, the domain was in the sources or it was not. You can be wrong about it, and someone can check you by reading the same answer.
An input metric describes work you did. Percentage of pages with schema markup. A content depth score. Number of pages published. Goodie's KPI list carries both kinds in one table - structured data implementation rate and content comprehensiveness sit beside citation rate (Goodie's AI search KPI list, accessed 2026-09-11). Input metrics are worth tracking. They belong in the work log, not in the row where the client reads whether anything changed, because a client can always tell the difference between "we did things" and "this is what the engines said".
Everything below is an outcome metric. Each one is a count of answers, divided by a count of answers.
The six AI search visibility metrics KPIs: numerator and denominator for each
Two booleans are scored on every delivered answer: mentioned - the engine wrote the brand name inside a sentence or a ranking, not merely attached as a trailing source chip - and cited (at least one URL on the brand's own domain appears in the sources). Everything else here is arithmetic on those two.
The chip distinction is not cosmetic. Across our own English-language brands, 20 to 41 per cent of raw brand-string hits are trailing chips, which are attributions rather than recommendations. Count them and the rate reads high; count them one month and not the next and the two months are not comparable. Whichever you choose, write the choice down beside the number: we exclude chips, which makes our mention rate read lower than a naive string match would.
| KPI | Numerator | Denominator | Smallest denominator we will print a % for | Client question it answers | What it cannot answer |
|---|---|---|---|---|---|
| Mention rate | Delivered answers that name the brand in the prose (trailing source chips excluded) | All delivered answers in the frame | 30 | Do the engines say our name at all? | Whether the mention helped, or why it moved |
| Citation rate | Delivered answers citing at least one URL on the brand's own domain | All delivered answers in the frame | 30 | Is our own site the source the engine used? | Whether anyone clicked through - and nothing at all on an engine whose sources we cannot capture |
| Conversion gap rate | Answers cited = yes and mentioned = no | Answers cited = yes | 30 cited answers - usually report the count instead | When the engine uses our content, how often does it drop our name? | Whether adding attribution will close it |
| Source gap rate | Answers mentioned = yes and cited = no | Answers mentioned = yes | 30 named answers - usually report the count instead | When they name us, whose page do they send the reader to? | Which page of ours would replace it |
| Prompt coverage | Prompts where the brand was named in at least one engine's answer | Prompts in the set | Report as a count out of the set, not a % | Which buyer questions are we missing entirely? | How much real demand each prompt carries |
| Share of named answers | Answers naming the brand | Answers naming at least one brand in the tracked set, the client's own included | 30 answers that name someone | Of the answers that recommend anyone, how often is it us? | Market share, and it will not sum to 100% across brands |
The last column is the one most lists skip, and it is the column that keeps a client meeting honest. A KPI that cannot say what it is blind to gets used to answer questions it was never measuring.
The "smallest denominator" column is a house convention, not a statistical result. The arithmetic behind it: a rate over a fixed denominator of d moves by 100/d percentage points when one answer flips. At 75 answers that is 1.3 points. At 12 it is 8.3. Printing "58.3%" over a denominator of twelve implies a precision the sample does not have, so below thirty we print the two counts and let the client see the size of the thing.
Rates whose denominator is itself a subset move less predictably, because a flip can land in both halves at once. A newly cited answer that does not name the brand takes the conversion gap from 7 / 12 to 8 / 13, which is 3.2 points rather than 8.3. Either way the small-denominator number is the unstable one; the difference is that a subset rate is unstable in two directions at once, so the 100/d figure is a ceiling on it rather than a reading of it.
The two gap rates are where this bites, because their denominators are subsets. Mention rate and citation rate run on every answer you collected. Conversion gap rate runs only on the answers that cited you, which in month one is often a dozen. Same report, same page, denominators differing by a factor of six - and nobody labels it. See conversion gap and source gap for what each one means and the single move each implies.
Setting the denominator before you set the target
The denominator is the whole methodology. Settle these seven things, write them on page one of the report, and change none of them mid-quarter.
The prompt set. A fixed, versioned, dated list of the questions the client's buyers actually ask. Change the list and you have started a new series, not continued the old one - so note the date you changed it and re-baseline. Our free AI visibility checker generates a 25-prompt starting set in five shapes - discovery, brand, comparison, problem-first and buying-intent - in the browser, with nothing sent anywhere; it is the same 25-prompt, 75-row frame the worked example below uses.
The engines, by name. ChatGPT, Perplexity, Gemini, Google AI Overviews, Google AI Mode and Microsoft Copilot behave differently and some of them do not always show sources. "Six engines" is not a frame; a named list is. Our free hand-run sample covers three of them; paid work covers all six.
Runs per prompt. The same prompt on the same engine can name a brand at 09:00 and skip it at 11:00. One run is a sample, not a measurement. Whatever number you pick, it multiplies into the denominator: prompts x engines x runs.
Delivered, not attempted. If an engine returned nothing, that run is not a zero - it is absent. Count what came back. (This is also why our own billing charges nothing for a failed run: a run that produced no answer is not data.)
URL normalisation, before you count a citation. Four moves, in this order. Drop the fragment first: engines append #:~:text= scroll-to-text anchors, and on our own collection 28 per cent of all citations carry one, which is enough to split a single cited page into a dozen one-hit rows and read a brand as having no owned sources at all. Then drop the click parameters (utm_*, gclid, fbclid, srsltid, ref), which identify a click rather than a page. Then lower-case the scheme and the host but leave the path untouched, because hosts are case-insensitive and paths are not. Then trim the trailing slash. Finally, dedupe by page rather than by chip: Gemini emits one source chip per highlighted passage, so 46.8 per cent of its citation slots are the same page again under a different anchor, against 1.2 per cent on ChatGPT and 0.7 per cent on AI Overviews - count slots and the wrong engine wins on volume it does not have. Decide separately, and write down which you chose, whether http and https, or www and the bare host, are one page or two. We keep them apart, which is the stricter reading and means our citation counts come out low rather than high.
Branded prompts, segmented. A prompt that already contains the brand name almost always produces a mention, so those runs measure the prompt set rather than the engines. Keep them in their own segment and out of the headline rate: on one of our own brands, folding them in roughly doubled the apparent visibility. Report them as "branded: n of d" beside the unbranded rate, never merged into it.
Citation capture is not uniform across engines. On our own collection, one surface - Google AI Mode - returns no source at all on about eight runs in ten, and that is our collector failing to capture them rather than the brand failing to be cited. A citation rate is only comparable across engines whose sources you can actually read. Print the per-engine denominators, flag the surface where capture is incomplete, and never roll a broken column into a single headline citation rate.
A worked example: 25 prompts, three engines, one fictional brand
Fervano is our fictional demo brand; the numbers below are an arithmetic illustration, not measured data from a real client. Frame: 25 prompts, three engines (ChatGPT, Perplexity, Gemini), one run each, one week. Delivered answers: 75.
Scored on the two booleans, those 75 answers land in four quadrants: 5 named and cited, 7 cited but not named, 19 named while the sources pointed elsewhere, 44 neither.
| KPI | Reading | Rate | One flip inside the same denominator moves it by | How we would print it |
|---|---|---|---|---|
| Mention rate | 24 / 75 | 32.0% | 1.3 pts | 24 / 75 · 32% |
| Citation rate | 12 / 75 | 16.0% | 1.3 pts | 12 / 75 · 16% |
| Conversion gap rate | 7 / 12 | 58.3% | 8.3 pts | 7 of 12 cited answers (no %) |
| Source gap rate | 19 / 24 | 79.2% | 4.2 pts | 19 of 24 named answers (no %) |
| Prompt coverage | 14 / 25 | 56.0% | 4.0 pts | 14 of 25 prompts |
| Share of named answers | 24 / 58 | 41.4% | 1.7 pts | 24 / 58 · 41% |
Three things fall out of the example that a metric name alone would never surface.
The headline rates and the gap rates are not the same measurement at different angles. They run on 75 and on 12. Putting "32%" and "58%" in adjacent cells with the same styling tells the client they are equally solid, and they are not.
The share denominator is 58, not 75, because 17 of the answers recommended nobody in the tracked set. If you divide by 75 instead you have quietly folded "no brand was recommended" into "a competitor won", which are different problems with different fixes.
And shares built this way do not sum to 100% across brands, because one answer can name three of them. If a client wants shares that add up, the unit has to be brand-mentions rather than answers - a different denominator, stated as such. That is not a hypothetical: the share column we print in a client workbook uses the brand-mention unit, summing each brand's named answers and dividing by that total, precisely so the column adds up. The row on this page uses the answer unit instead, and reads lower. Both are defensible. Printing one while describing the other is not, which is why the unit belongs in the column header rather than in a footnote. AI share of voice is a summary of the same booleans, not a separate measurement.
Why we do not report position, sentiment or a standalone score
Three metrics appear on nearly every published list and on none of our reports. Each exclusion is a choice with a reason, not a gap in the product.
Position. Peec AI's KPI guide carries position as one of its core KPIs, on the reasoning that a brand named earlier in the response gets more of the reader's attention (Peec AI's KPI guide, accessed 2026-09-11). An AI answer is one piece of prose, not an ordered list of ten results, so there is no rank to occupy. The ordinal position of the first brand mention inside a paragraph is a real, readable thing - it is just not a ranking, and it moves between two runs of the same prompt. If you do report it, define it as exactly that and say so in the report, so nobody reads it as a SERP position.
Sentiment. It is the most common recommendation across this whole category: Peec's guide, LLM Pulse's GEO metrics guide (accessed 2026-09-11) and Geneo's KPI post all put brand sentiment near the centre. We do not run it, and the reason is our own rule rather than a judgement on theirs: we have published no sentiment rubric a client could apply to the stored answers and arrive at the same reading. A number the client cannot re-derive is the exact thing this method exists to avoid. We also do not fact-check whether what an engine said about a brand is true.
A standalone composite score. Goodie lists an AI Visibility Score as its second KPI. Geneo's KPI post goes further and publishes benchmark bands - B2B tech brands averaging 55 to 65, leaders 70 to 85 - without stating how the number is computed (Geneo's KPI post, accessed 2026-09-11). A composite merges signals that fail for different reasons: a brand at "40" might be invisible everywhere or dominant in half the category and absent in the other half, and those need opposite work.
Our own workbook does carry one blended index - 0.6 times the mention rate plus 0.4 times the citation rate, on a 0 to 100 scale, weights we chose rather than derived. So the honest version of this position is narrower than "no score". In that workbook it sits in the same row as the two rates it was built from, never on its own, and the weights are written down here so that anyone holding the workbook can take it apart. Our own console is looser: the index leads the overview as its own card, and an alert title can be that number and nothing else, with the two component rates on cards beside it. That is the same trade this section warns about; it is better stated here than found in a screenshot. What we will not do is put a number in front of a client that cannot be opened back to the answers it came from, or hand over a band from someone else's benchmark as a target. There is no self-serve scanner behind this page either. That is the whole argument of evidence, not a score.
One more terminology note, since this page is dense with it: "source gap" is used differently elsewhere in this category, and a reader arriving from another vendor's glossary may have a different definition in mind. The one that governs every number on this page is at source gap.
Putting the KPIs into a monthly client report
Five rules that make these AI search visibility KPIs survive contact with a client.
- Frame on page one. Prompt set version and date, engine list, runs per prompt, sampling window, and delivered versus attempted counts. If the frame changed, that is the first line of the report, not a footnote.
- Write every rate as numerator, denominator, percent. Our own report workbook prints each cell on the mention-rate and citation-rate sheets as
n / d · p%for exactly this reason - the reader sees the size of the sample in the same glance as the number. The summary sheet in front of them is the exception, carrying bare percentages with the run count in an adjacent column; that is a compromise, and it is the sheet we would change first. - Two counts, not a rate, under the floor. Below thirty in the denominator, print "7 of 12". This one is a convention we are asking for rather than one we have finished: our own workbook still prints a percentage at every denominator, and rounds it to a whole number. Until that changes, read any cell whose denominator is under thirty as two counts and ignore the percent.
- An appendix of the answers themselves. Every rate must be openable: the verbatim answer, the cited URLs after normalisation, the engine, the timestamp. A client who can check one row stops needing to check the rest.
- Diff against the client's own history, never a benchmark. An industry band you cannot reproduce is not a target. Last month's number on the same frame is.
SEO client reporting when AI answers eat clicks has the full section order for the deliverable these rows go into; this page stays on the definitions.
What these KPIs cannot prove
Read them as observations of what six engines said inside a stated frame. They are not a causal claim and not a forecast.
They cannot prove a fix caused a change. If mention rate rises after a content push, the honest report shows the before-and-after with both frames identical and stops there - the engines also changed, the web also changed, and nobody can separate those from a timeline. They cannot promise an engine will ever name a brand; nobody can sell that. They do not measure tone, and they do not check whether what the engine said was true. They say nothing about traffic: an answer that named a brand and got no click looks identical here to one that sent a visitor, because both are read off the answer, not off analytics. And prompt coverage measures coverage of your list only - absence from 11 of 25 prompts is not absence from the category, because a 25-prompt set is a probe, not a census.
Questions agencies ask
Which AI search visibility metrics KPIs belong in a monthly client report?
Two headline rates, two gap readings, one coverage count, one competitive share - six rows, and each with its denominator printed beside it. Mention rate and citation rate answer "are we there at all", the conversion gap and source gap answer "what kind of absence is this", prompt coverage shows which buyer questions have no presence to improve, and share of named answers puts it against competitors. Anything past six rows usually duplicates one of them under a new name. If a metric on your current list cannot be written as a count of answers over a count of answers, it belongs in the work log rather than the client report.
What is the minimum sample size for a mention rate?
We print a percentage at a denominator of thirty or more and two raw counts below that. It is a convention rather than a statistical threshold, and the arithmetic is the argument: at thirty answers, one answer flipping moves the rate by 3.3 points, which is already larger than most month-to-month changes worth discussing. At twelve, one flip moves it 8.3 points. Twenty-five prompts on three engines gives seventy-five delivered answers, which clears the floor for the headline rates - but the gap rates run on subsets of that, and those subsets are usually still under it in the first month.
Should a client report carry one headline visibility number?
It is the easiest number to present and the hardest to defend, which is a bad trade for a retainer. A composite folds together two kinds of absence that need opposite work, so the client cannot read from it what to do next. The first time someone asks what changed between 61 and 64, you either explain the weighting or lose the room. Keep a blended index if a dashboard needs one, but publish the weights, print it beside the rates it came from, and never let it travel alone into a slide. If the client insists on one number, use mention rate with its denominator visible and say plainly what it excludes. More on that trade in why we report rates instead of a score.
Why do two tools report different mention rates for the same brand?
Usually the definition, not the sampling. Set both vendors' outputs against the two booleans on this page and the disagreement usually resolves: ask each one whether a brand name sitting in a trailing source chip counts as a mention, and whether a run whose prompt already contains the brand name is inside the headline denominator. Neither is a rounding difference - both change what goes in the numerator, and the sizes are in the sections above. Then check the frame: prompt set, engine list, region, logged-in state, runs per prompt. The point is not who is right but that the gap becomes explainable, and an explainable gap is one a client can be walked through. Charting both vendors on one axis is the move to avoid: pick one frame and track movement inside it. Mention vs citation sets out the two booleans.
Do these KPIs replace AI referral traffic in the report?
No, they sit beside it and answer a different question. Referral traffic from AI assistants is measured in the client's own analytics and is chronically under-counted, because a reader who sees a brand named in an answer often arrives later through a branded search or a direct visit, which no tool attributes back to the answer. These six KPIs measure what the engine said, inside a frame you control. Traffic measures what happened afterwards, inside a frame you do not. Report both, and never present one as proof of the other.
See the numbers on one of your own clients
Pick a client, then read the rows before you commit to any definition. Ask us for a free sample audit - a brand, a URL, an email - and a mini evidence report comes back covering three engines run by hand: what each of ChatGPT, Perplexity and Gemini actually wrote, which sources sat under it, and whether the brand was in the prose, in the source list, or both. Two working days, nothing to pay, no account. Where the frame earns a retainer line, the scheduled version covers all six engines.
Related blogs
Related Post
Expand your knowledge with these hand-picked posts.
Mention vs Citation: Why AI Cites Your Content but Never Names Your Brand
When an AI answer links your page but never says your name, that is a conversion gap. What the mention and citation booleans mean, why the gap happens, the attribution lever you can pull, and how to monitor brand mentions in ChatGPT without a black-box score.
Gan Liu
Source Gap vs Conversion Gap: A 2x2 Framework for AI Visibility Audits
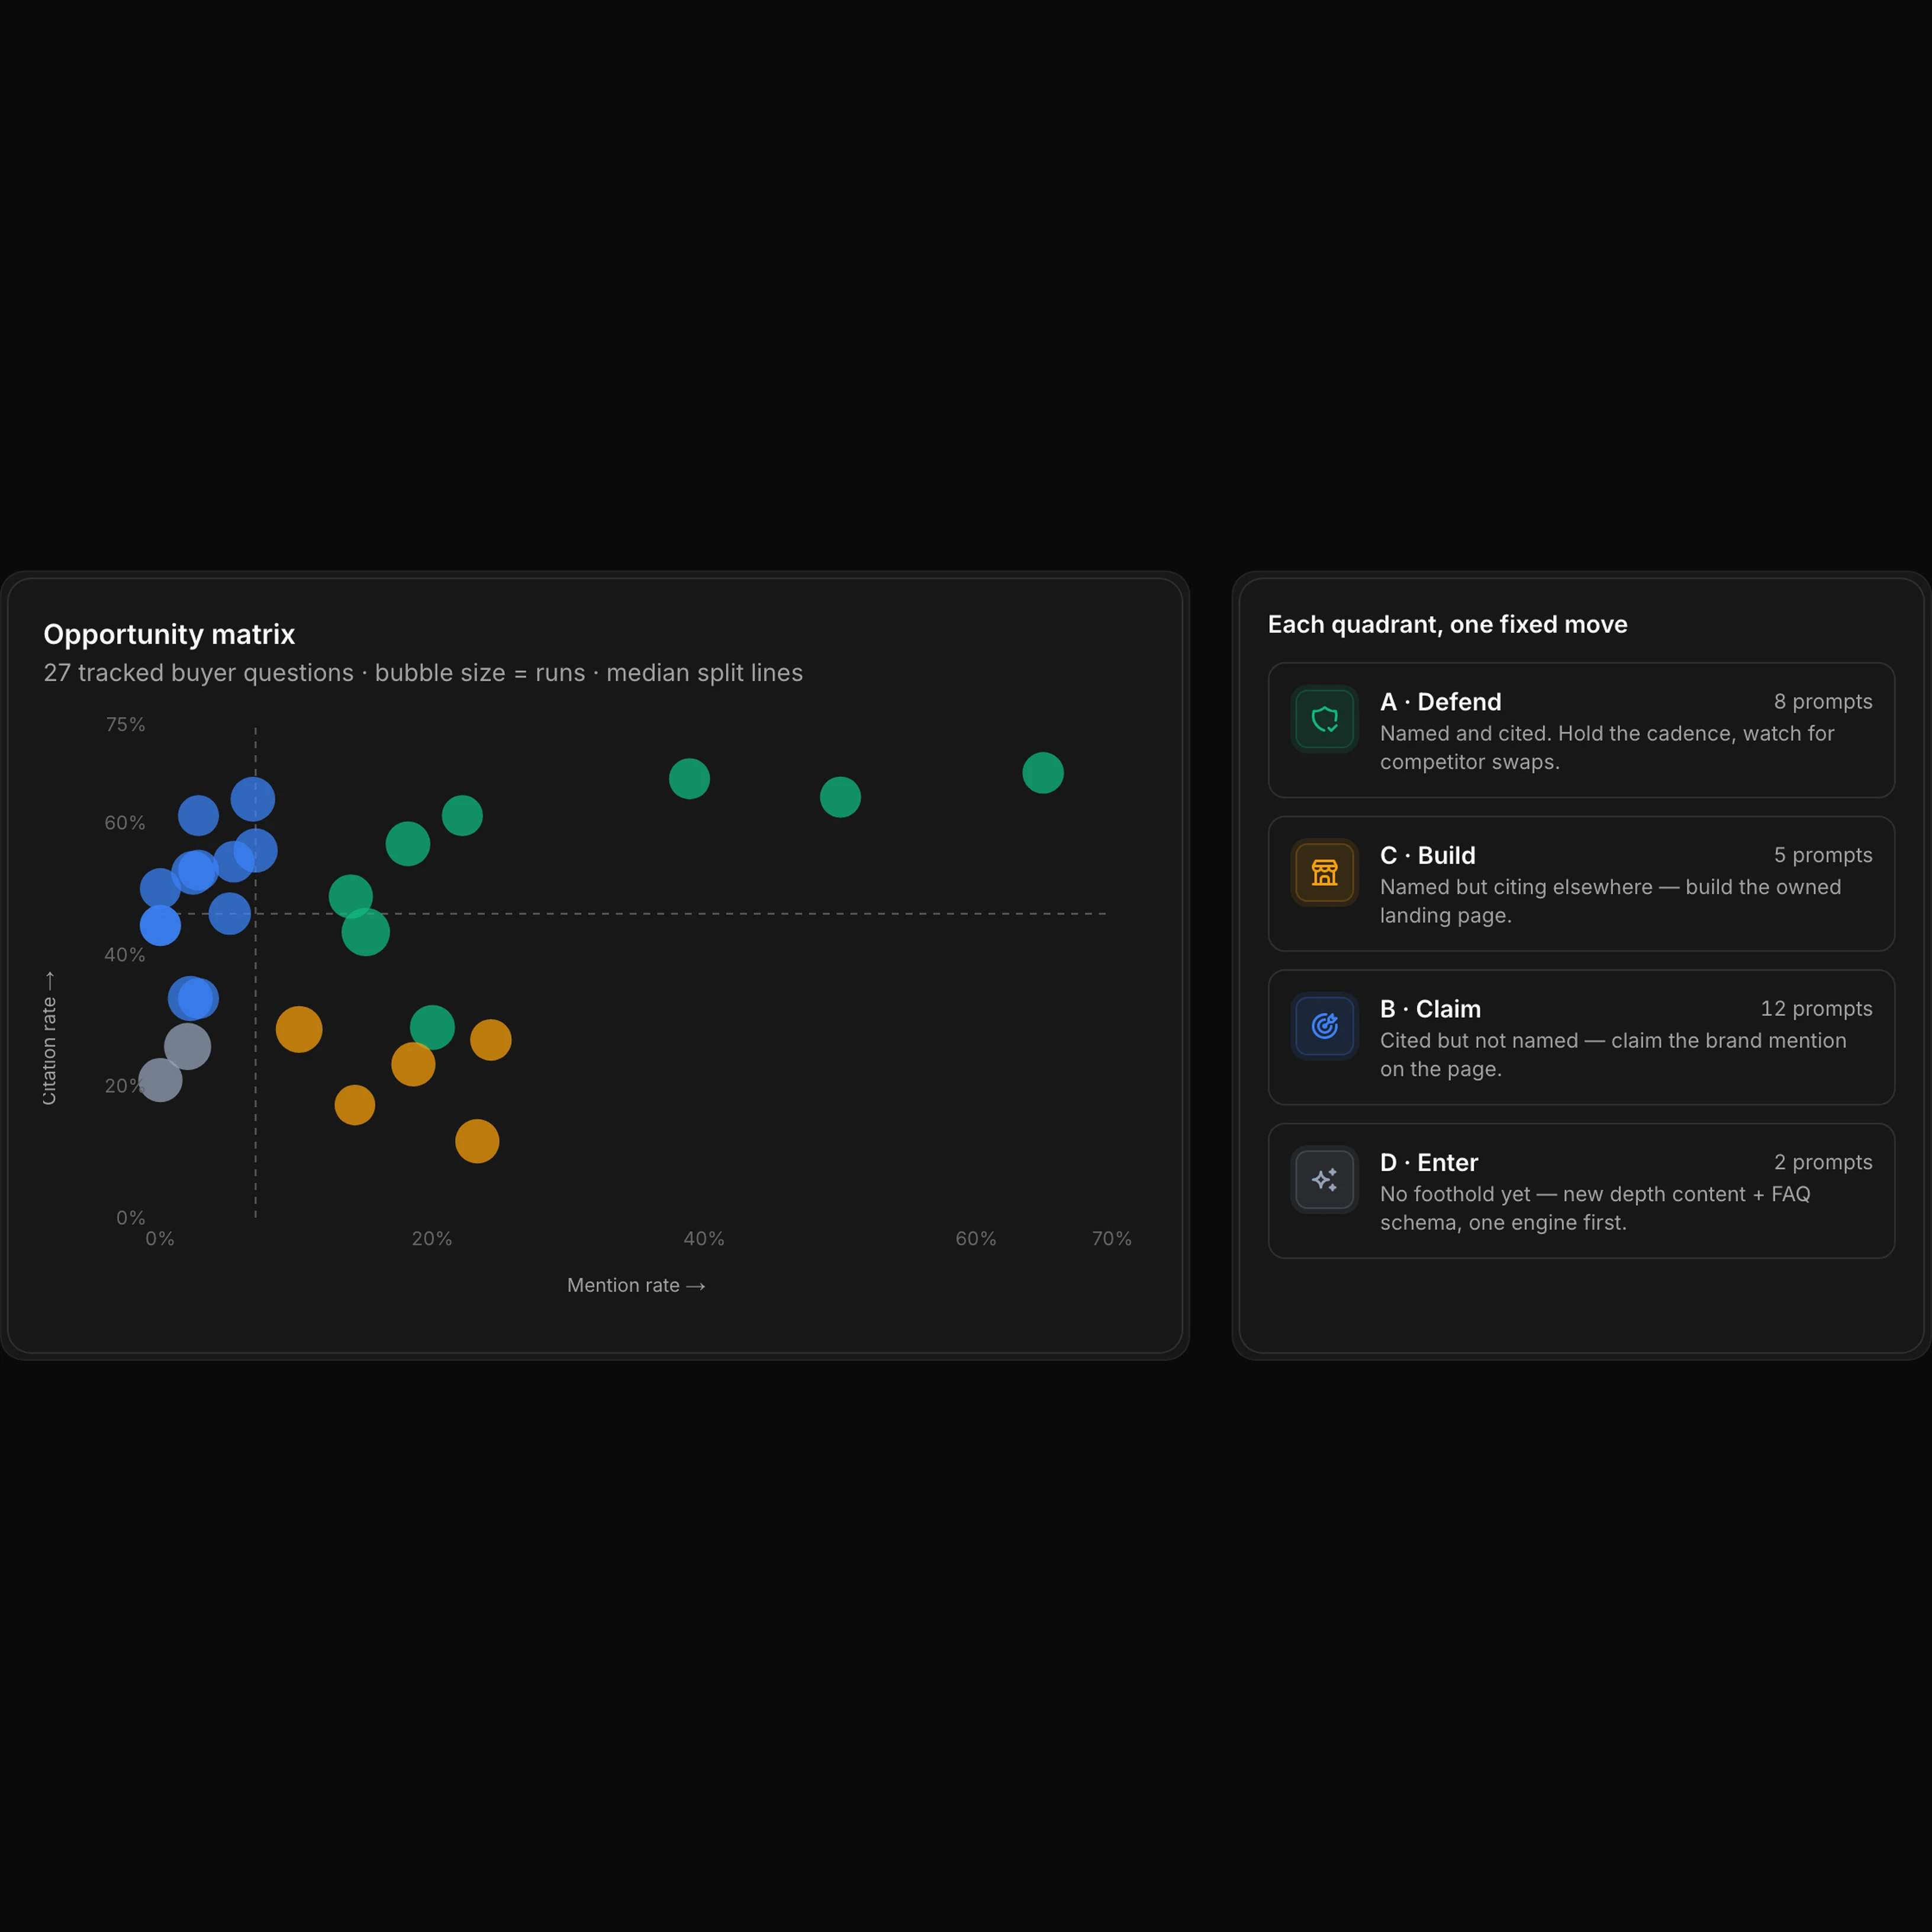
Score every prompt on two booleans - brand named, own domain cited - and every AI answer lands in one of four quadrants: stronghold, conversion gap, source gap, or whitespace. Each quadrant has one fixed move.
Gan Liu
Input-Side Grounding vs Output-Side Verification: Where GEO Fits in the Ontology and RAG Stack
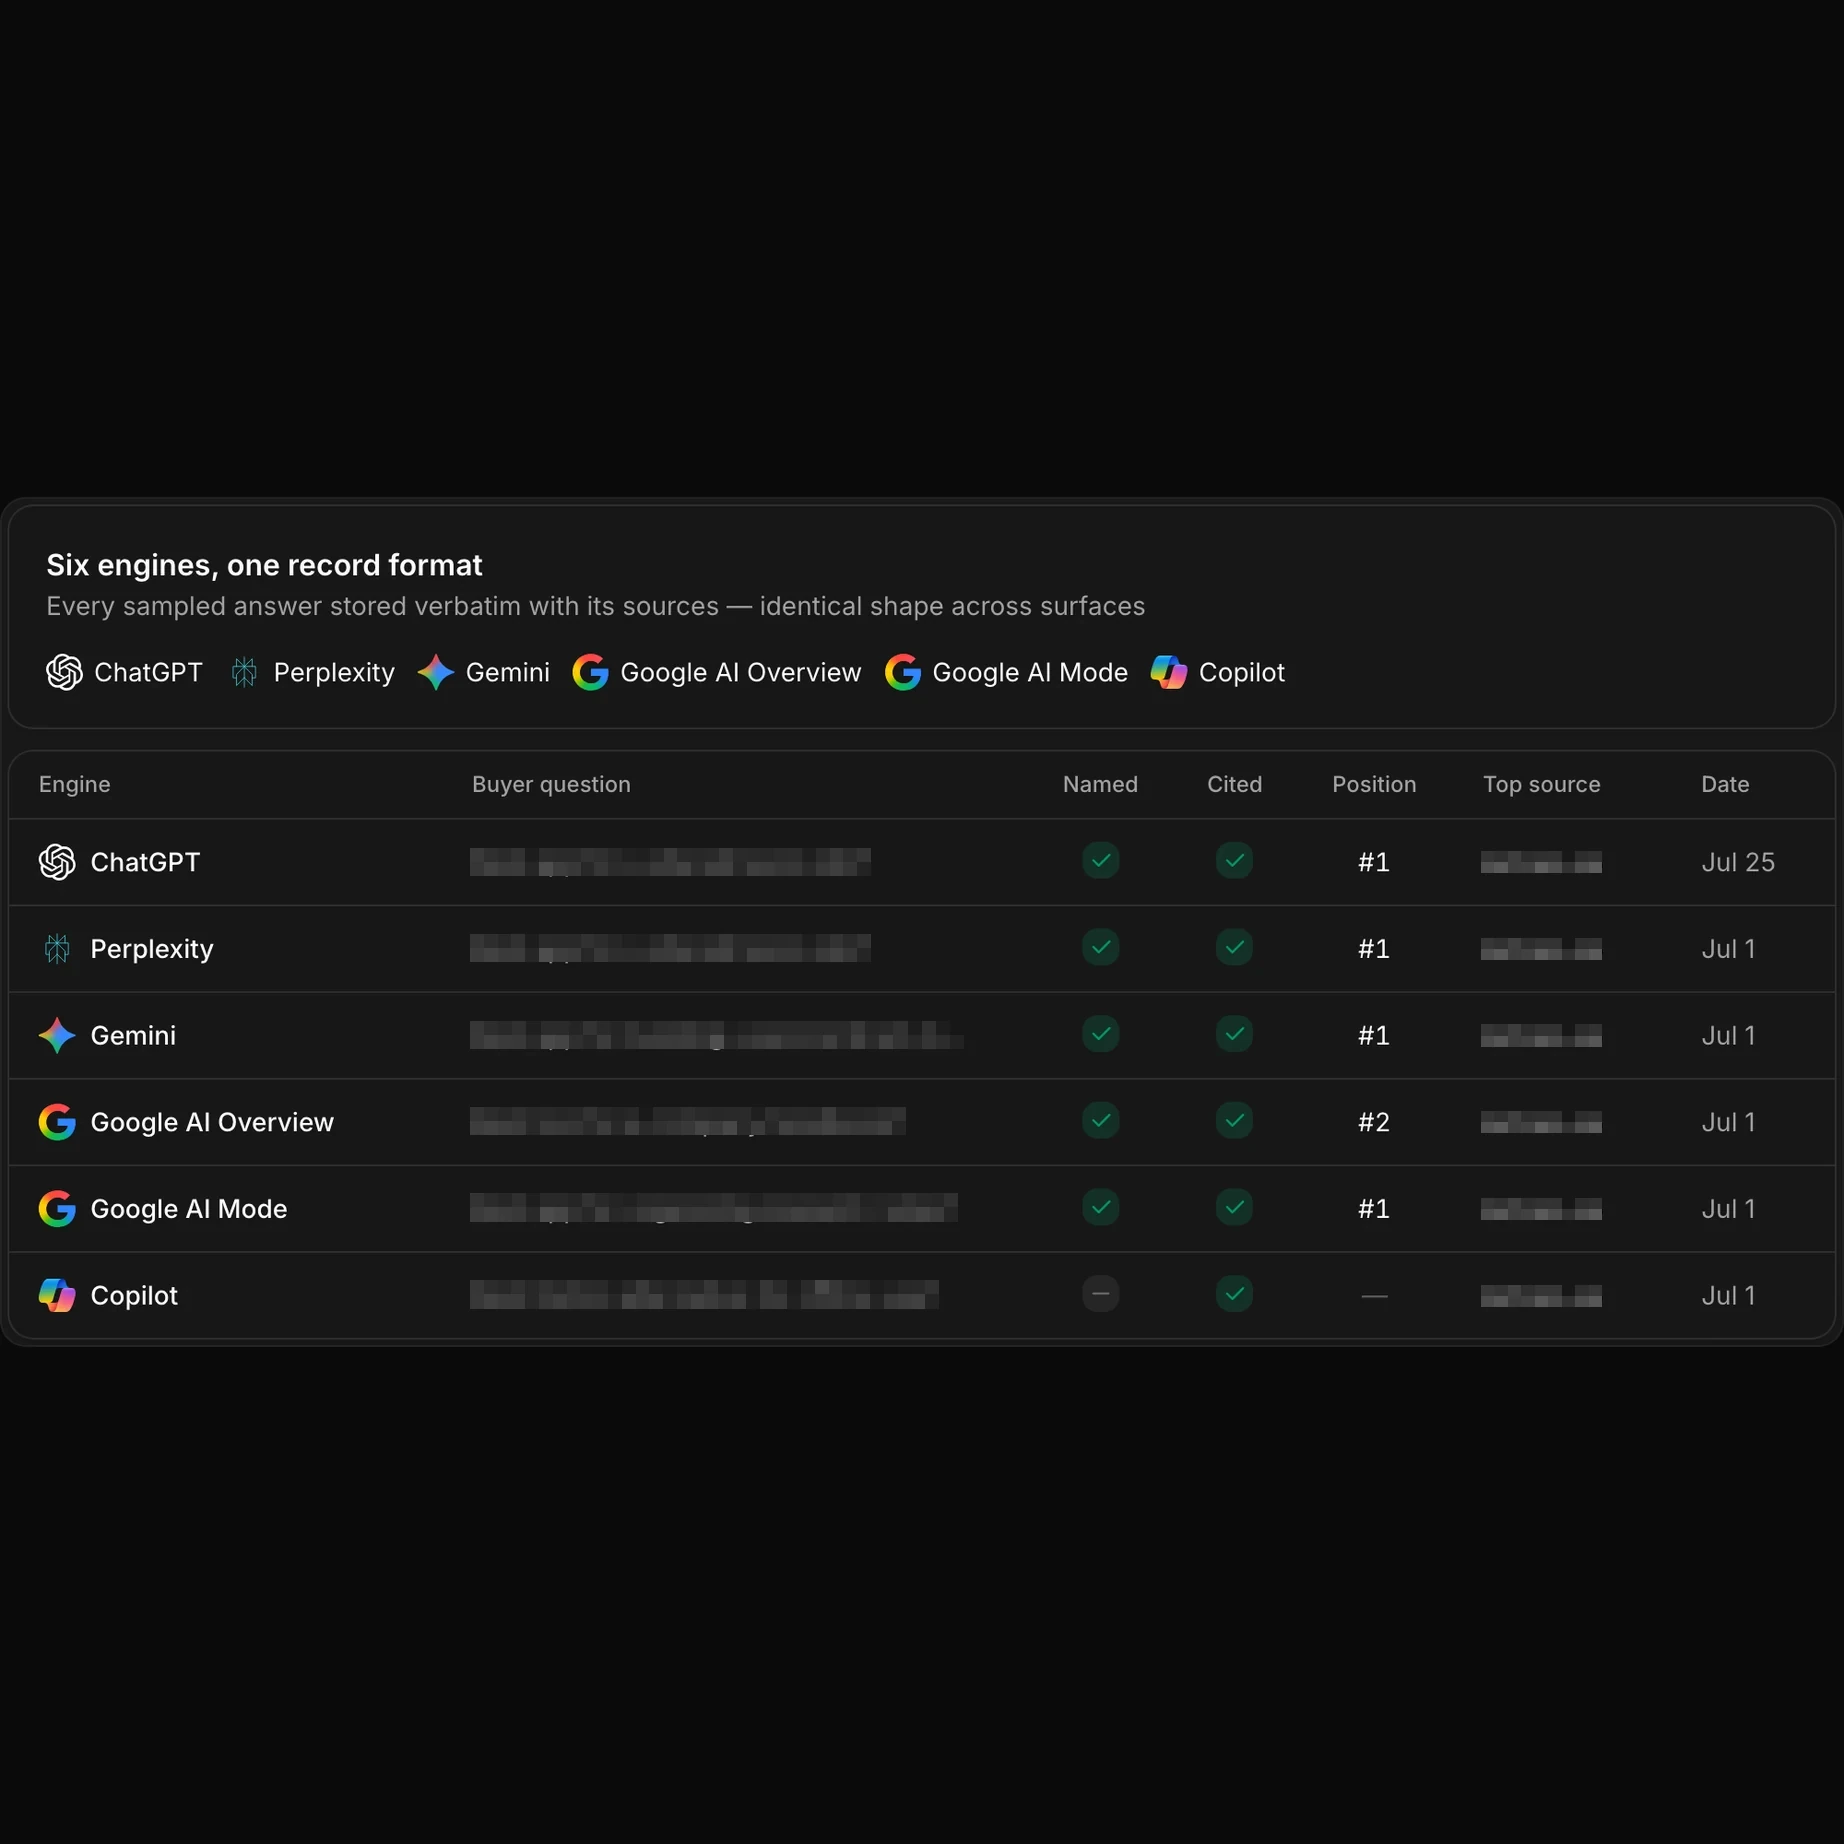
Ontology, RAG, and grounding feed your own AI so it understands your business. GEO verification is the mirror image: checking whether external answer engines named your brand and cited your domain.
Gan Liu
See what AI says. Then fix it.
Send one brand. Get the answers, the sources, and the first gaps worth fixing.
No card. No call. No catch. Reply in 2 business days.