What Is the AI Visibility Score, and What Does It Hide?
An AI visibility score is one number built from vendor-chosen weights. We take a published formula apart, change its weights, and show what to report instead.
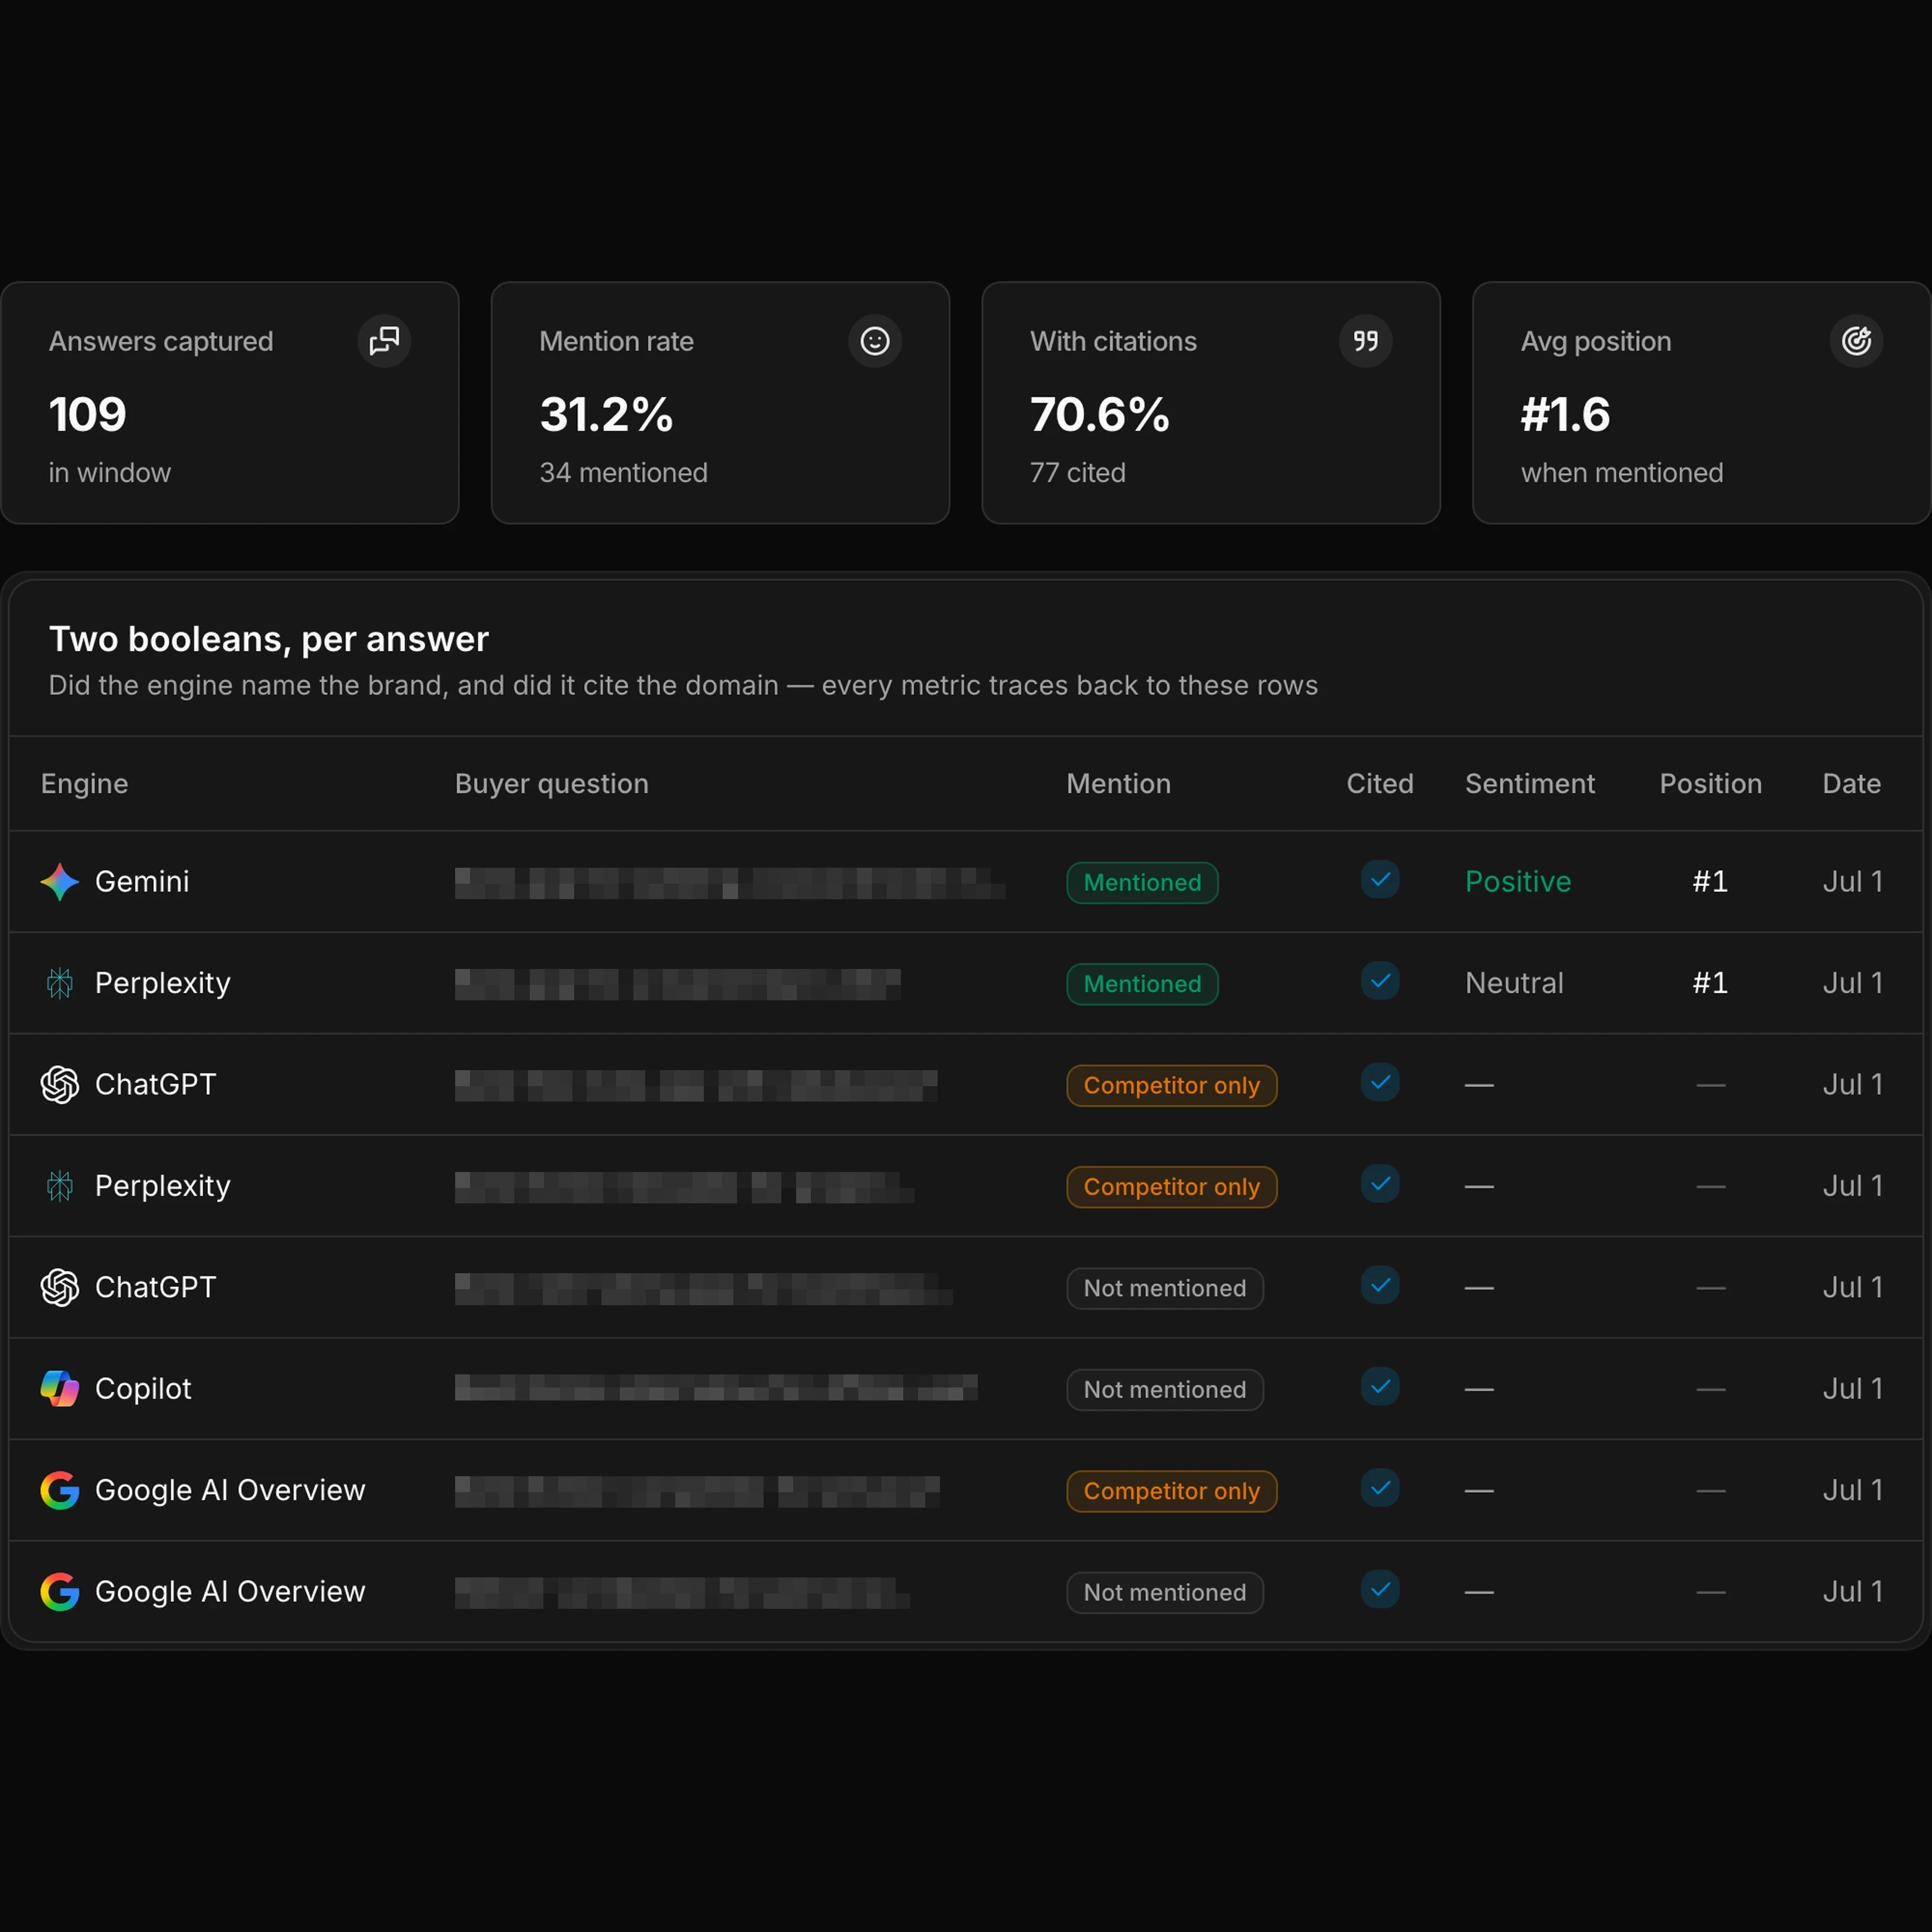
TL;DR: What is the AI visibility score? It is a composite number a vendor computes from a sample of AI answers, using a prompt set, a placement rubric, a sentiment adjustment and a set of engine weights the vendor chose. There is no industry definition, so two tools can hand your client different numbers for the same brand in the same week and both be internally correct. The table below names five published definitions of the phrase, each with the page we read it on, the day we read it, and what that page states about its own arithmetic; below we take the one that states the arithmetic in full, change nothing but its weights, and watch the same worked example read 29.2% or 23.5%. A score is a defensible internal trend line when the recipe never moves. It is a poor headline for a client report, because it merges two failures — not being named, and being named without being cited — that have two different fixes.
This page is about the metric itself. For the reporting principle behind it, see evidence, not a score. For the two signals a score usually replaces, see mention vs citation and the longer source gap vs conversion gap framework. For picking a vendor rather than reading their metric, see how to choose an AI visibility provider.
What is the AI visibility score? The definition, and why there isn't one
It is whatever the vendor says it is. No standards body publishes an AI visibility score definition, no two products compute it the same way, and the phrase covers at least three different measurements: how often answer engines name a brand, how ready a single page looks for citation, and a blended index that folds classic rankings in alongside AI mentions.
Five published examples, checked on 2026-09-11:
| What it is called | Who publishes it | Scale | What goes in | Arithmetic published? |
|---|---|---|---|---|
| AI Search Visibility Score | Geneo (article dated 2025-11-30) | Percentage | Presence, prominence and an expected-click proxy per answer; a sentiment multiplier; per-engine weights | Yes, in full — but as a DIY method article, not as this vendor's own product formula |
| GEO Score | Frase | 0–100 per page | Page-level signals the vendor associates with being cited | No. Bands are given (above 80 strong, 60–79 solid) without a stated derivation |
| Search Performance Index (SPI) | Rankability (article dated 2026-06-11) | 0–100 per keyword | One number per keyword that folds in classic rank positions on four search engines (Google, Bing, DuckDuckGo, Brave) plus map-pack and video placements, then adds whether AI answers mention or cite the brand | No |
| AI visibility score (generic) | HubSpot (updated 2026-04-27) | Not specified | Six named components: platform coverage, mention frequency, citations, sentiment, consistency, share of voice | No. The advice is to standardise your own method, document the formula and keep it consistent |
| Visibility Score (classic SEO) | AgencyAnalytics (page dated 2023-06-12) | Percentage | A weight per ranking position, averaged across tracked keywords by search volume | Described, with one illustrative weight and no published table |
Two things follow. First, a client asking "what is the AI visibility score" is asking about a family of unrelated metrics, and the honest first answer is "which one, and whose?" Second, only one of these five hands you any arithmetic at all — and even that is a method article rather than a product's own recipe. That makes it the useful one to examine, and Geneo deserves the credit for publishing it — a formula can only be taken apart once it is written down, and this one is.
Taking one published formula apart
Geneo's page sets out four steps. Per prompt on one engine, a contribution is presence multiplied by prominence multiplied by an expected-click proxy. Those contributions are averaged over the prompt count to give a per-engine value. That value is multiplied by one plus a sentiment term capped at plus or minus 0.2. The per-engine results are then multiplied by engine weights and summed.
Count the decisions that have to be made before a single answer is captured:
- Which engines are in scope at all. The worked example uses Google, Perplexity and ChatGPT. Gemini, Google AI Mode as a distinct surface, and Microsoft Copilot are simply outside the number.
- The prompt set and its size. The worked example uses 20 prompts, though the checklist on the same page recommends 25 to 50. Twenty prompts is a probe, not a census.
- What counts as presence. In this formula, 1 if the brand is cited or mentioned, 0 if neither, with fractional values allowed for indirect references. Hold that thought.
- The prominence rubric. Illustrative values on Google: 0.8 for the top link cluster, 0.5 for an expandable placement, 0.3 for a mention with no link.
- The expected-click proxy. On Google: 0.6, 0.3 and 0.15 for those same three placements. On Perplexity: 0.5 for a first-cluster citation, 0.25 otherwise. On ChatGPT with search on: 0.4 and 0.2.
- The sentiment term and its cap. Three classes, bounded at plus or minus 0.2.
- The engine weights. The example uses 0.5 for Google, 0.3 for Perplexity, 0.2 for ChatGPT.
Seven author choices. None is wrong. All of them are arguable, and every one of them moves the output.
What changes when only the recipe changes
Geneo's worked example publishes its sentiment-adjusted per-engine values: Google 0.352, Perplexity 0.280, ChatGPT 0.162. They are illustrative — the page introduces them with "suppose", and the twenty prompts behind them are an assumption too — and that is exactly what makes them usable here. Everything after those three numbers is arithmetic, so the weights can be swapped without touching the inputs. (They are worked-example values, not a captured run. The arithmetic behaves the same way on real ones.)
| Weighting choice | Reasoning a person might give | Score |
|---|---|---|
| Google 0.5, Perplexity 0.3, ChatGPT 0.2 | The published worked example | 29.2% |
| Equal weight, one third each | We have no basis for ranking the engines | 26.5% |
| Google 0.2, Perplexity 0.3, ChatGPT 0.5 | Our buyers start in ChatGPT, not in Google | 23.5% |
| Published weights, sentiment multiplier removed | We do not score tone, only presence | 28.0% |
Same inputs, same rubric, nothing re-measured. The readings span 5.7 percentage points, and the highest is roughly a quarter larger than the lowest. If your client's target for the quarter sits anywhere inside that band, the target is being set by a spreadsheet decision rather than by anything an engine said.
The second problem is that the multiplication is not reversible. Presence, prominence and expected clicks collapse into one contribution before anything is averaged, so different situations land on the same number. Using the rubric above, a Google placement is worth 0.48 in the top cluster, 0.15 expandable, 0.045 mention-only:
| What the 20 Google answers actually looked like | Sum of contributions | Per-engine value |
|---|---|---|
| Named in the top link cluster of 5 answers; absent from the other 15 | 5 × 0.48 = 2.40 | 0.12 |
| Present in 13 answers: 2 top cluster, 9 expandable, 2 mention-only | 0.96 + 1.35 + 0.09 = 2.40 | 0.12 |
One brand is prominent in a quarter of the answers and invisible in the rest. The other trails through two thirds of them as a footnote. Those call for different work, and the score reports them identically. (The placement counts are arithmetic run against the published rubric to show the property, not measurements of any brand.)
Why one number merges two different failures
Look again at decision three: presence is 1 if the brand is cited or mentioned. That single or is where the information goes.
An answer engine can do four things with a brand, and only four:
| Named in the answer text | Own domain in the cited sources | What it is | The move |
|---|---|---|---|
| Yes | Yes | Stronghold | Hold it and watch for drift |
| Yes | No | Source gap | Find the URL cited in your place and out-publish it |
| No | Yes | Conversion gap | Anchor the brand name beside the claims that get quoted |
| No | No | Whitespace | Coverage first; there is nothing to optimise yet |
Rows two and three are opposite problems with opposite fixes, and both enter that formula as presence = 1. A brand can move a hundred answers from row three to row two, do real and expensive work, and see the score sit still. It can also drift from row one to row three and watch the score barely dip. Neither of those is a bug in the arithmetic; it is what the or was for.
Nothing here promises a fix will land. Answer engines are not under anyone's control, and the only defensible claim is the before-and-after: this is what the engines said in March, this is what they said in June, this shipped in between. Correlation stated plainly, causation not asserted.
The same answers, reported two ways
The alternative is not "no numbers". It is numbers that open.
| Composite score report | Two-boolean record | |
|---|---|---|
| The unit | One number per brand per period | One row per prompt, per engine, per run |
| What is stored | The number and its trend line | The verbatim answer, every cited source with tracking parameters stripped, the engine, the timestamp and the sampling window |
| Named and cited | Merged into presence | Two columns, never averaged together |
| "Why did it move?" | Re-derive it from the rubric | Open the answers that changed |
| Client challenges a row | You defend the method | You open the answer and read it together |
| Comparable with another vendor's figure | No | No — but the underlying answers are readable by anyone |
Every row in the right-hand column is the same work a score does, minus the compression step. You can still produce a rate — percentage of sampled answers that named the brand, percentage that cited its domain — and you should, because a client needs something to look at. Report them as two rates, per engine, with the denominator printed. That is what AI share of voice is when it is done honestly: a summary that survives being clicked into.
Our own composite, and its weights
It would be easy to write this page as if we had no dog in the fight. We do, so here is our own number.
Jincove has no instant online scanner and no self-serve score. The free browser tool at our AI visibility checker deliberately returns 25 prompts and a 75-row sheet rather than a rating, and the reason is the argument above: a number we cannot show you the answers behind is the thing this page objects to.
But the monitoring workbook we ship does carry a per-brand visibility index in its summary sheet, and the first stat card in our own console shows an index built from the same formula. It is computed like this:
visibility index = 100 × (0.6 × mention rate + 0.4 × citation rate)
The 0.6 and the 0.4 are ours. They are not derived from click data, from any study, or from anything outside our own judgement that being named matters somewhat more than being cited. Move them to 0.5 and 0.5 and every brand's index moves. We publish them here so you can discount them.
Mention rate is the term that needs pinning down, and our two surfaces do not pin it down the same way. The workbook counts a mention only where the brand appears inside the answer text, so a trailing source chip carrying the name is an attribution rather than a mention. The console leads with the wider count that does include those chips, and prints the narrower reading beneath it wherever a run carries that split. One formula, two denominators, two different indices — which is why the detail sheet keeps both columns on every row, so either reading can be rebuilt from the same answers. A published formula whose key term is left undefined is not a disclosure, and that applies to ours as much as to anyone's.
One more disclosure, because it is the kind of thing this page exists to catch. Four pages already published on this site tell agencies that teams wanting one headline visibility number will find our reports uncomfortable, because we do not produce one. That sentence is wrong, and it is wrong in our favour, which is the worse direction to be wrong in. It is queued for correction behind the edit freeze those pages are under; this section is the current answer.
Three rules keep it honest, and they are the rules we would apply to anyone's score, including the one place we do not yet meet them:
- The composite sits in the same row as its inputs. Mention rate, citation rate, prompt count and answer count are all in that summary line, and the console's overview puts the two rates beside the index. The index is a sort key for a roster, not the finding. Our own regressions view breaks this rule: it shows how far the index moved without the two rate movements that drove it, and that is a defect on our side rather than a design choice.
- Every rate opens. The detail sheet carries the full answer record behind each row, and where a screenshot was captured, the thumbnail sits in the cell.
- It never leaves the client. It is not benchmarked against another agency's clients and not compared with any vendor's score, because the weights are not shared and neither are the prompt sets.
We have run no controlled comparison against any other tool, and nobody in this category — us included — has published one, so nothing above claims our method measures more accurately than theirs. It claims something narrower: you can check ours.
Five questions to ask when a vendor hands you a score
- What is the denominator? How many prompts, across how many engines, over what window, in which region, logged in or out. A score without a denominator is a rating, not a measurement.
- How many times was each prompt run, and what is reported? Generative answers move between runs of the same prompt. One sample, a mean and a median are three different numbers.
- Who chose the weights, and can we see the score without them? If the unweighted per-engine values are available, you can re-run the arithmetic the way we did above. If they are not, ask why.
- Can we open the answer behind any single row? Not a chart of the row — the text the engine returned and the sources it listed.
- What happens to last quarter when you change the recipe? Restated and labelled, or silently re-based? The second one quietly rewrites a client's history.
HubSpot's guidance gets as far as writing the formula down and keeping it consistent. That is the right instinct and it stops one step short: consistency protects you from month-to-month drift, but it does nothing for a client who never sees the formula in the first place.
When a score is still the right tool, and how to improve one honestly
Not every use is a bad one.
- An internal trend line you own, with the recipe frozen and the prompt set unchanged, compared only against its own history. This is the legitimate case and it is a real one.
- A sort key across a roster. Twelve brands, one column, decide who gets attention this week. Nobody has to believe the number in the absolute.
- A pitch opener, if and only if you can follow it immediately with the answers that produced it.
And the cases where it is the wrong tool, ours included: comparing two vendors' scores; setting a contractual KPI on a number whose recipe the vendor can change; reporting a single headline figure to a client with no path back to the source material; and diagnosing what to fix, which requires the named and cited columns kept apart.
The question that follows is how to improve an AI visibility score. You cannot improve the composite itself, and a number that rises without either underlying rate rising is a recipe change rather than progress. What can move is the source-gap and conversion-gap work from the four-way table earlier: out-publish the URL cited in your place, and anchor the brand name beside the claims that already get quoted. None of that is guaranteed to land, because no one controls what an engine says. It is at least aimed at the measurement instead of at the formula.
Questions buyers ask
What is the AI visibility score, and who defines it?
Nobody defines it in a way that binds anyone else. It is a vendor-specific composite built from a sample of AI answers, and the components vary widely: Geneo has published a full DIY method — presence, placement, an expected-click proxy and sentiment across weighted engines — though not the formula behind its own product; Rankability's SPI folds classic Google, Bing, DuckDuckGo and Brave rankings in with AI mentions and citations; Frase scores a single page for citation readiness rather than measuring answers at all. When a client or a prospect uses the phrase, the first job is to find out which of those they mean, because the three describe different things and cannot be compared with each other.
Is an AI visibility score the same as an SEO visibility score?
No, though the names invite the confusion and some products blend both. A classic SEO visibility score weights ranking positions across a tracked keyword set, usually scaled by search volume — the AgencyAnalytics definition is a clear example of that older shape. An AI visibility score is measured inside generated answers, where there is no ordered list of results to hold a position in. If a vendor reports a "position" for a synthesised answer, ask what is being positioned: it is usually either the classic result set behind the same query, or a prominence rubric the vendor invented. Ask us the same thing: our console carries an average-position tile, and what it averages is where a brand sat in a recommendation list inside the answer, counted only over the answers that placed it at all. That is not a search result position.
Why do two tools give my client different AI visibility scores?
Because they sampled different things and then compressed them differently. Five inputs move independently between vendors: the prompt set, the engine list, the region and login state, how many times each prompt is run, and where the line for a "mention" is drawn — a bare occurrence of the brand string for one, an actionable recommendation for the next. Then each product lays its own weights over the result. Two honest tools can disagree substantially without either being wrong. The practical rule is to pick one method, write it down, and compare a brand only against its own history. Never merge two vendors' figures into one client chart.
Does Jincove have an AI visibility score?
Not as a product. There is no instant scanner, no self-serve rating, and the free browser tool returns a prompt set and a scoring sheet instead of a number. The monitoring workbook does carry a visibility index, computed as 100 × (0.6 × mention rate + 0.4 × citation rate) over the mentions that sit inside the answer text, and we publish those weights above precisely so they can be argued with. It is printed beside the two rates it came from, with the full answer record behind it, and we do not compare it to anyone else's score.
What should I put in a client report instead of a score?
Two rates and a denominator, per engine: the share of sampled answers that named the brand, and the share that cited its domain, out of a stated number of prompts over a stated window. Add the four-way split — stronghold, source gap, conversion gap, whitespace — because that is what tells the client what work comes next. Then link each rate to the stored answers. If a chart is wanted, chart the two rates as separate lines; the moment they are averaged, the report can no longer say which problem the client has. The tool shortlist for agencies covers which products keep them apart.
What is the AI brand visibility score?
Usually a narrower thing than a general AI visibility score: how often answer engines name the brand itself, rather than how citable one page looks or how a blended index moves. Nobody defines this one either, so the same three questions apply. What is the denominator, which engines were sampled, and does "named" mean the brand string turned up anywhere in the answer or that the answer recommended it. Those are different measurements sitting under one label. If a vendor reports a brand visibility score and a page-level score without saying which is which, ask which one the number in front of you is, because the two cannot be averaged into anything a client can act on.
See the answers before you trust anyone's number
A score is easiest to judge next to the material it was computed from. Ask us for a free sample audit: a brand, a URL and an email is the whole intake. Three engines get your buyers' questions put to them by hand — ChatGPT, Perplexity, Gemini — and two working days later you have each answer as written, the sources beneath it, and the named-versus-cited call. No payment, no signup, and deliberately no score on top.
If the material is useful, the same method runs on a schedule — ChatGPT, Perplexity and Gemini, then Google AI Overviews, Microsoft Copilot and Google AI Mode.
Related blogs
Related Post
Expand your knowledge with these hand-picked posts.
Mention vs Citation: Why AI Cites Your Content but Never Names Your Brand
When an AI answer links your page but never says your name, that is a conversion gap. What the mention and citation booleans mean, why the gap happens, the attribution lever you can pull, and how to monitor brand mentions in ChatGPT without a black-box score.
Gan Liu
Source Gap vs Conversion Gap: A 2x2 Framework for AI Visibility Audits
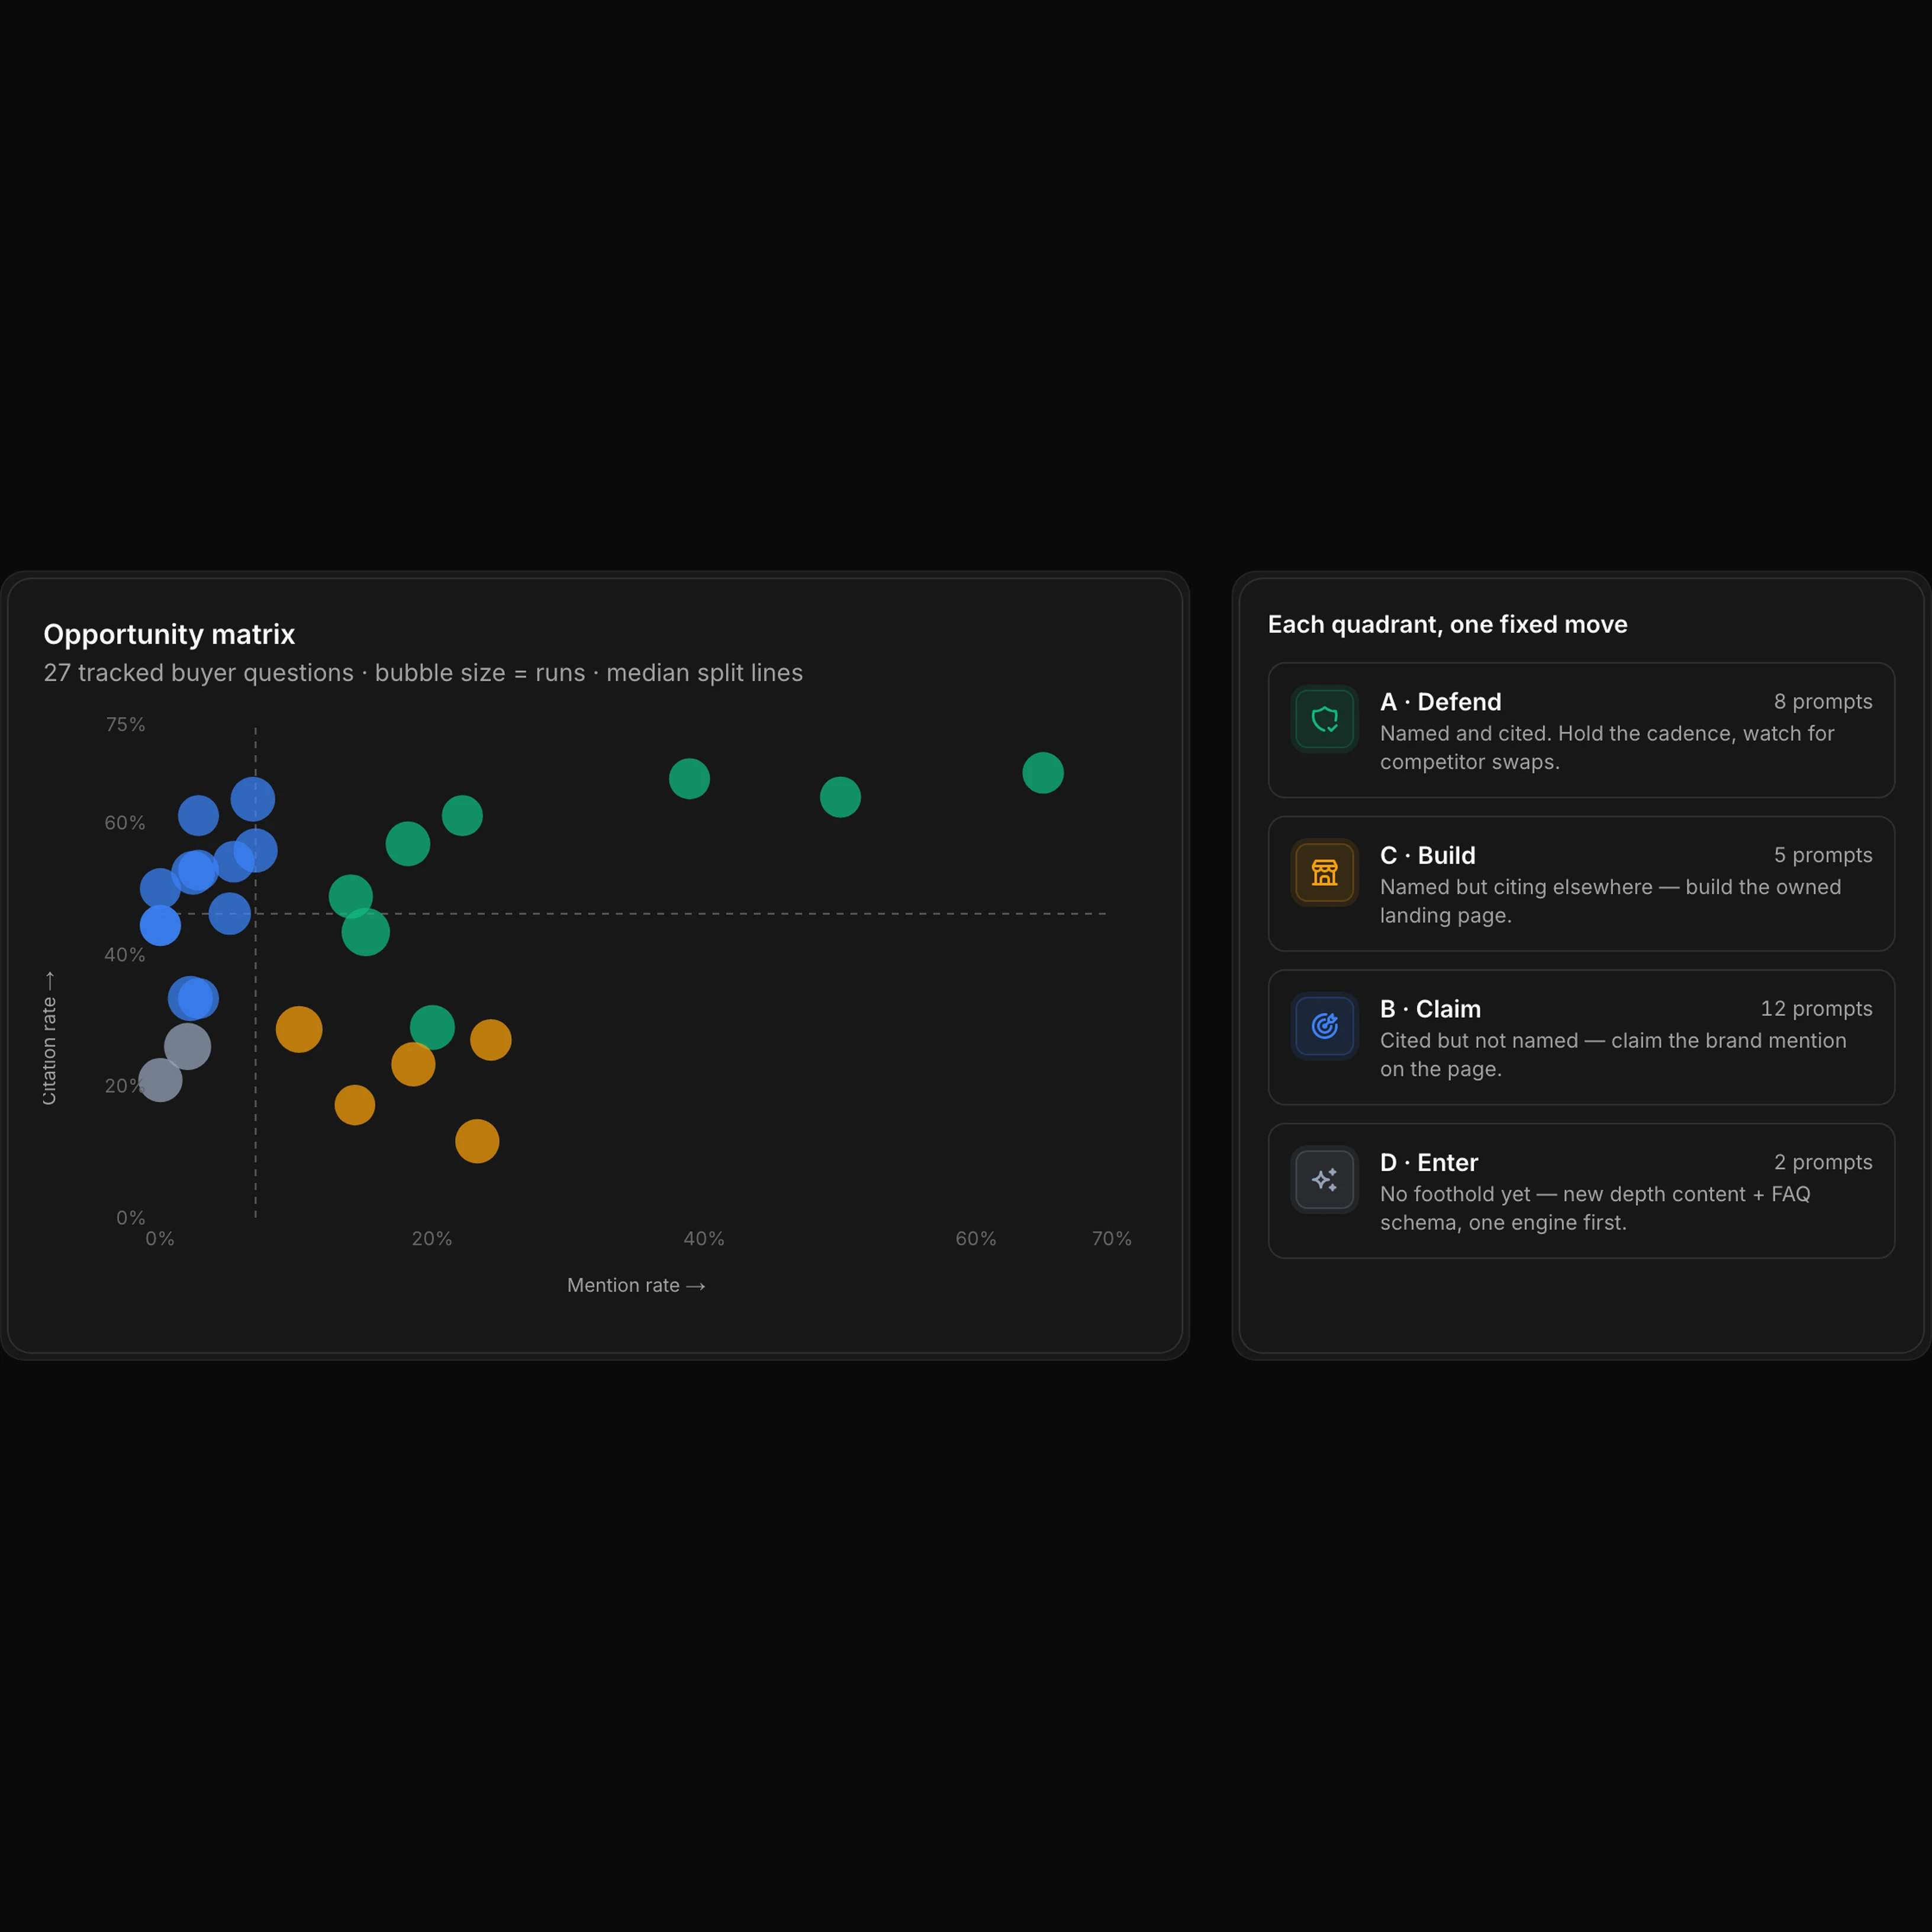
Score every prompt on two booleans - brand named, own domain cited - and every AI answer lands in one of four quadrants: stronghold, conversion gap, source gap, or whitespace. Each quadrant has one fixed move.
Gan Liu
Input-Side Grounding vs Output-Side Verification: Where GEO Fits in the Ontology and RAG Stack
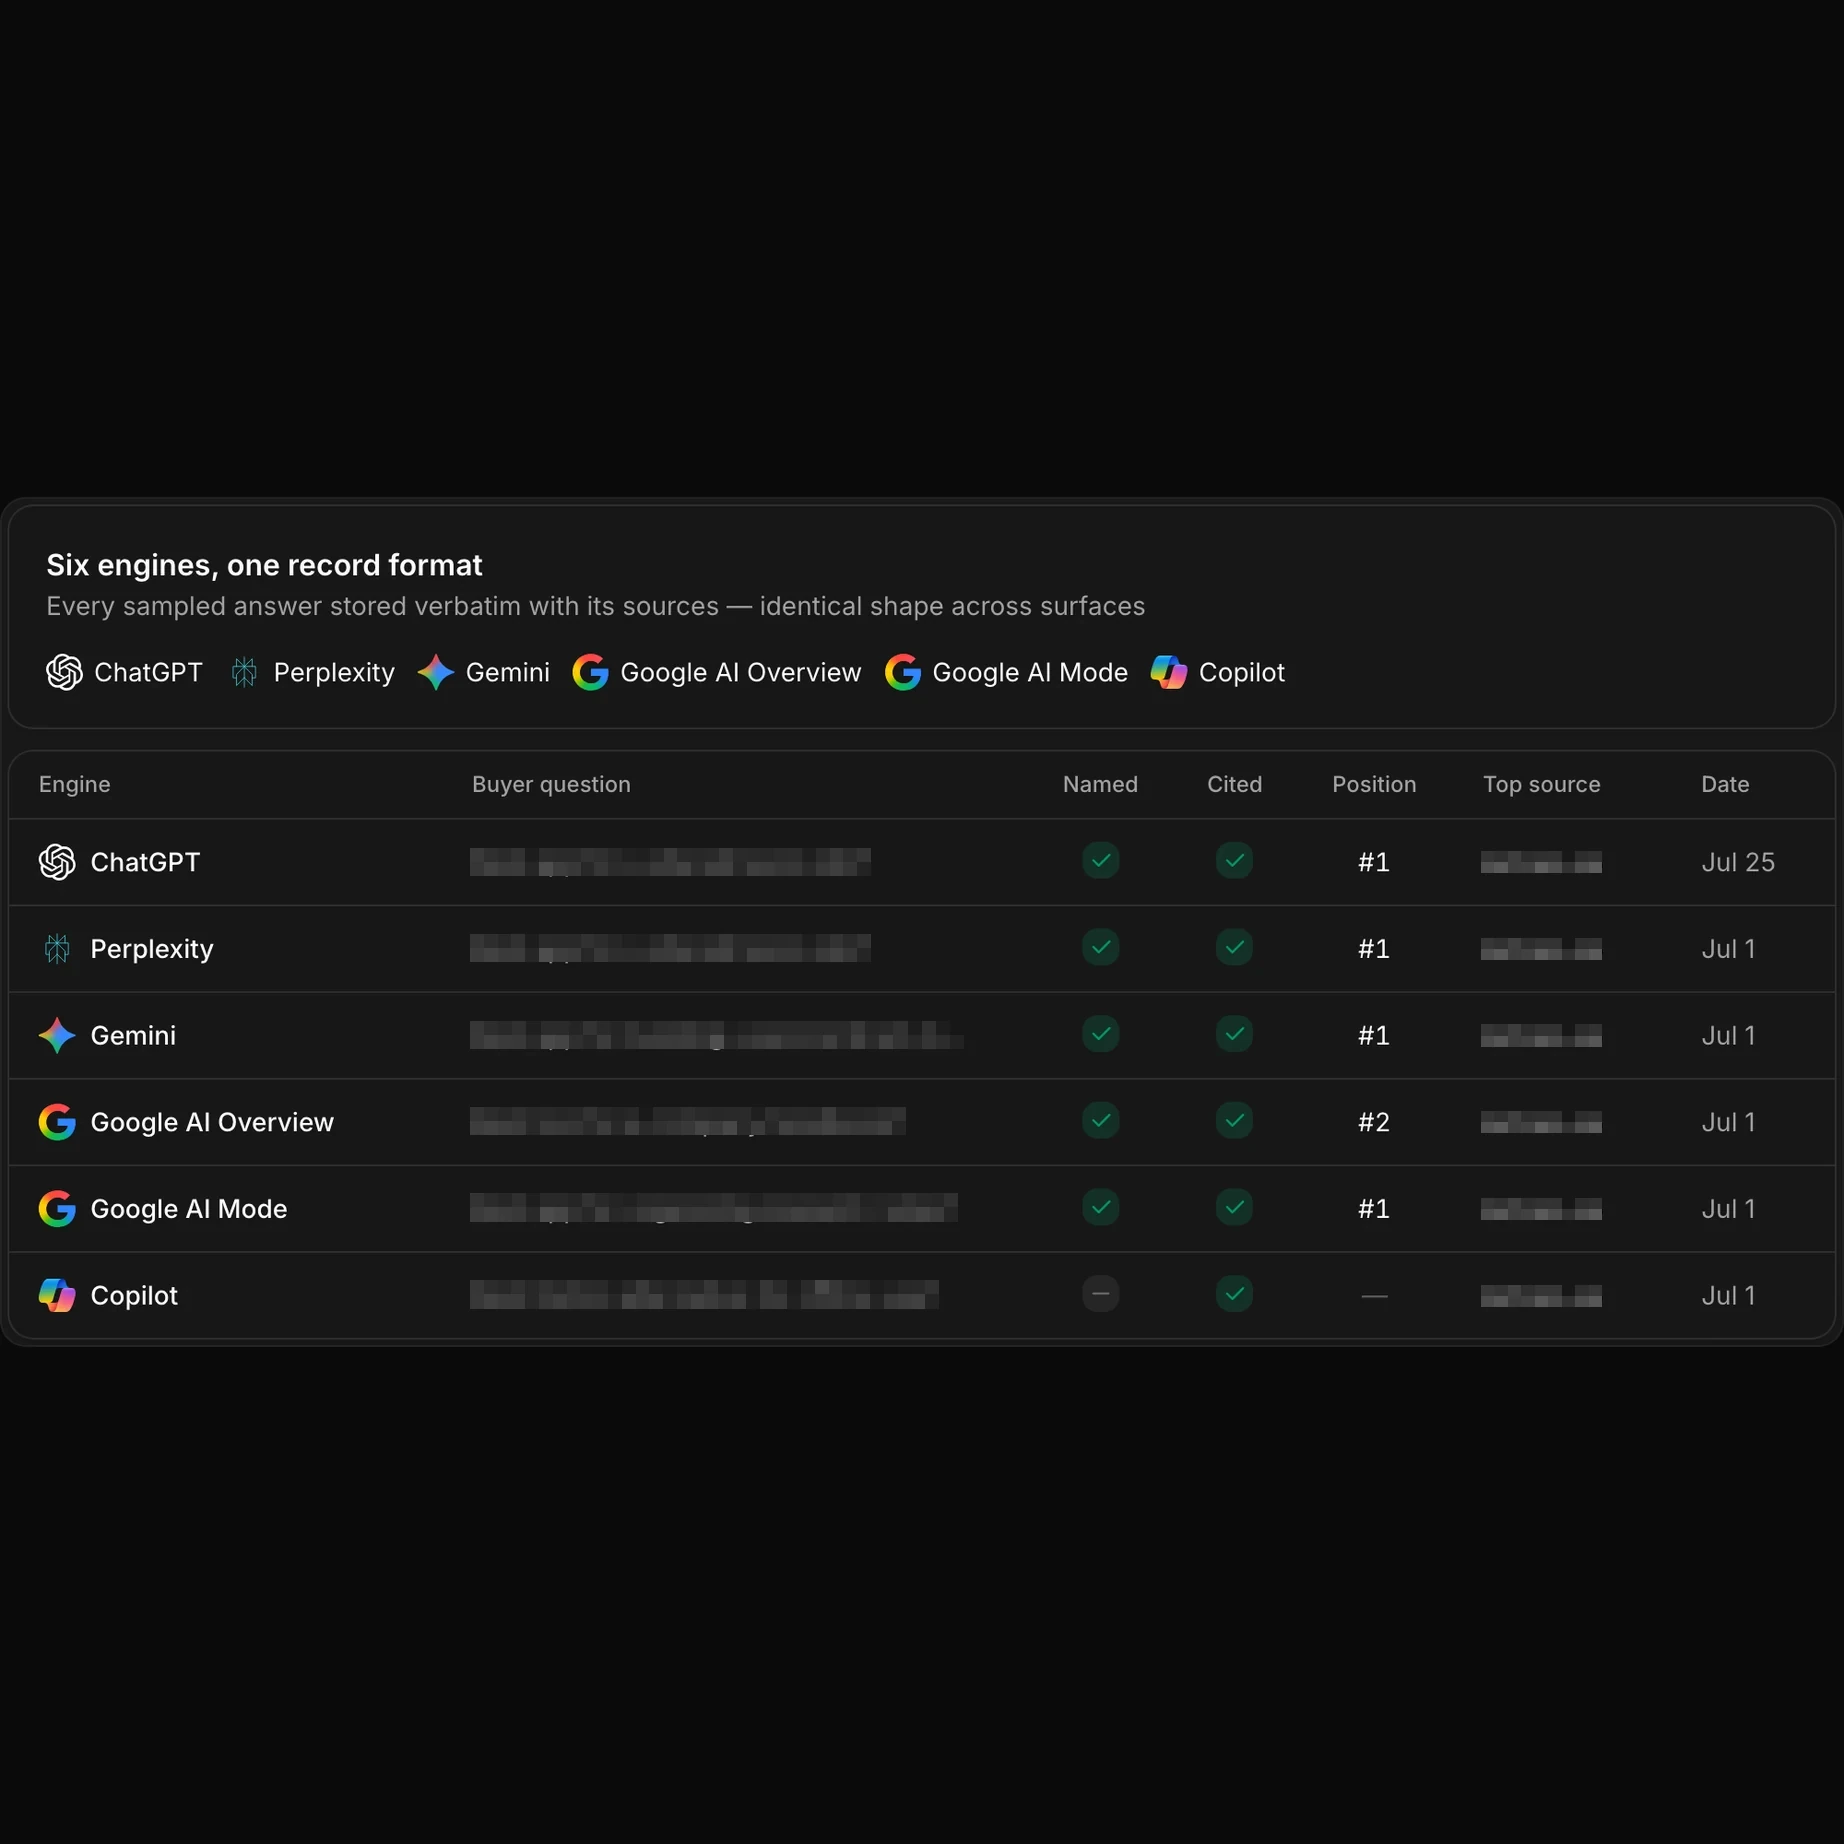
Ontology, RAG, and grounding feed your own AI so it understands your business. GEO verification is the mirror image: checking whether external answer engines named your brand and cited your domain.
Gan Liu
See what AI says. Then fix it.
Send one brand. Get the answers, the sources, and the first gaps worth fixing.
No card. No call. No catch. Reply in 2 business days.