AI Share of Voice: The Formula and the Denominator
AI share of voice, measured so a client can re-run it: declare the denominator, split named from cited, repeat every run, and skip invented benchmarks.
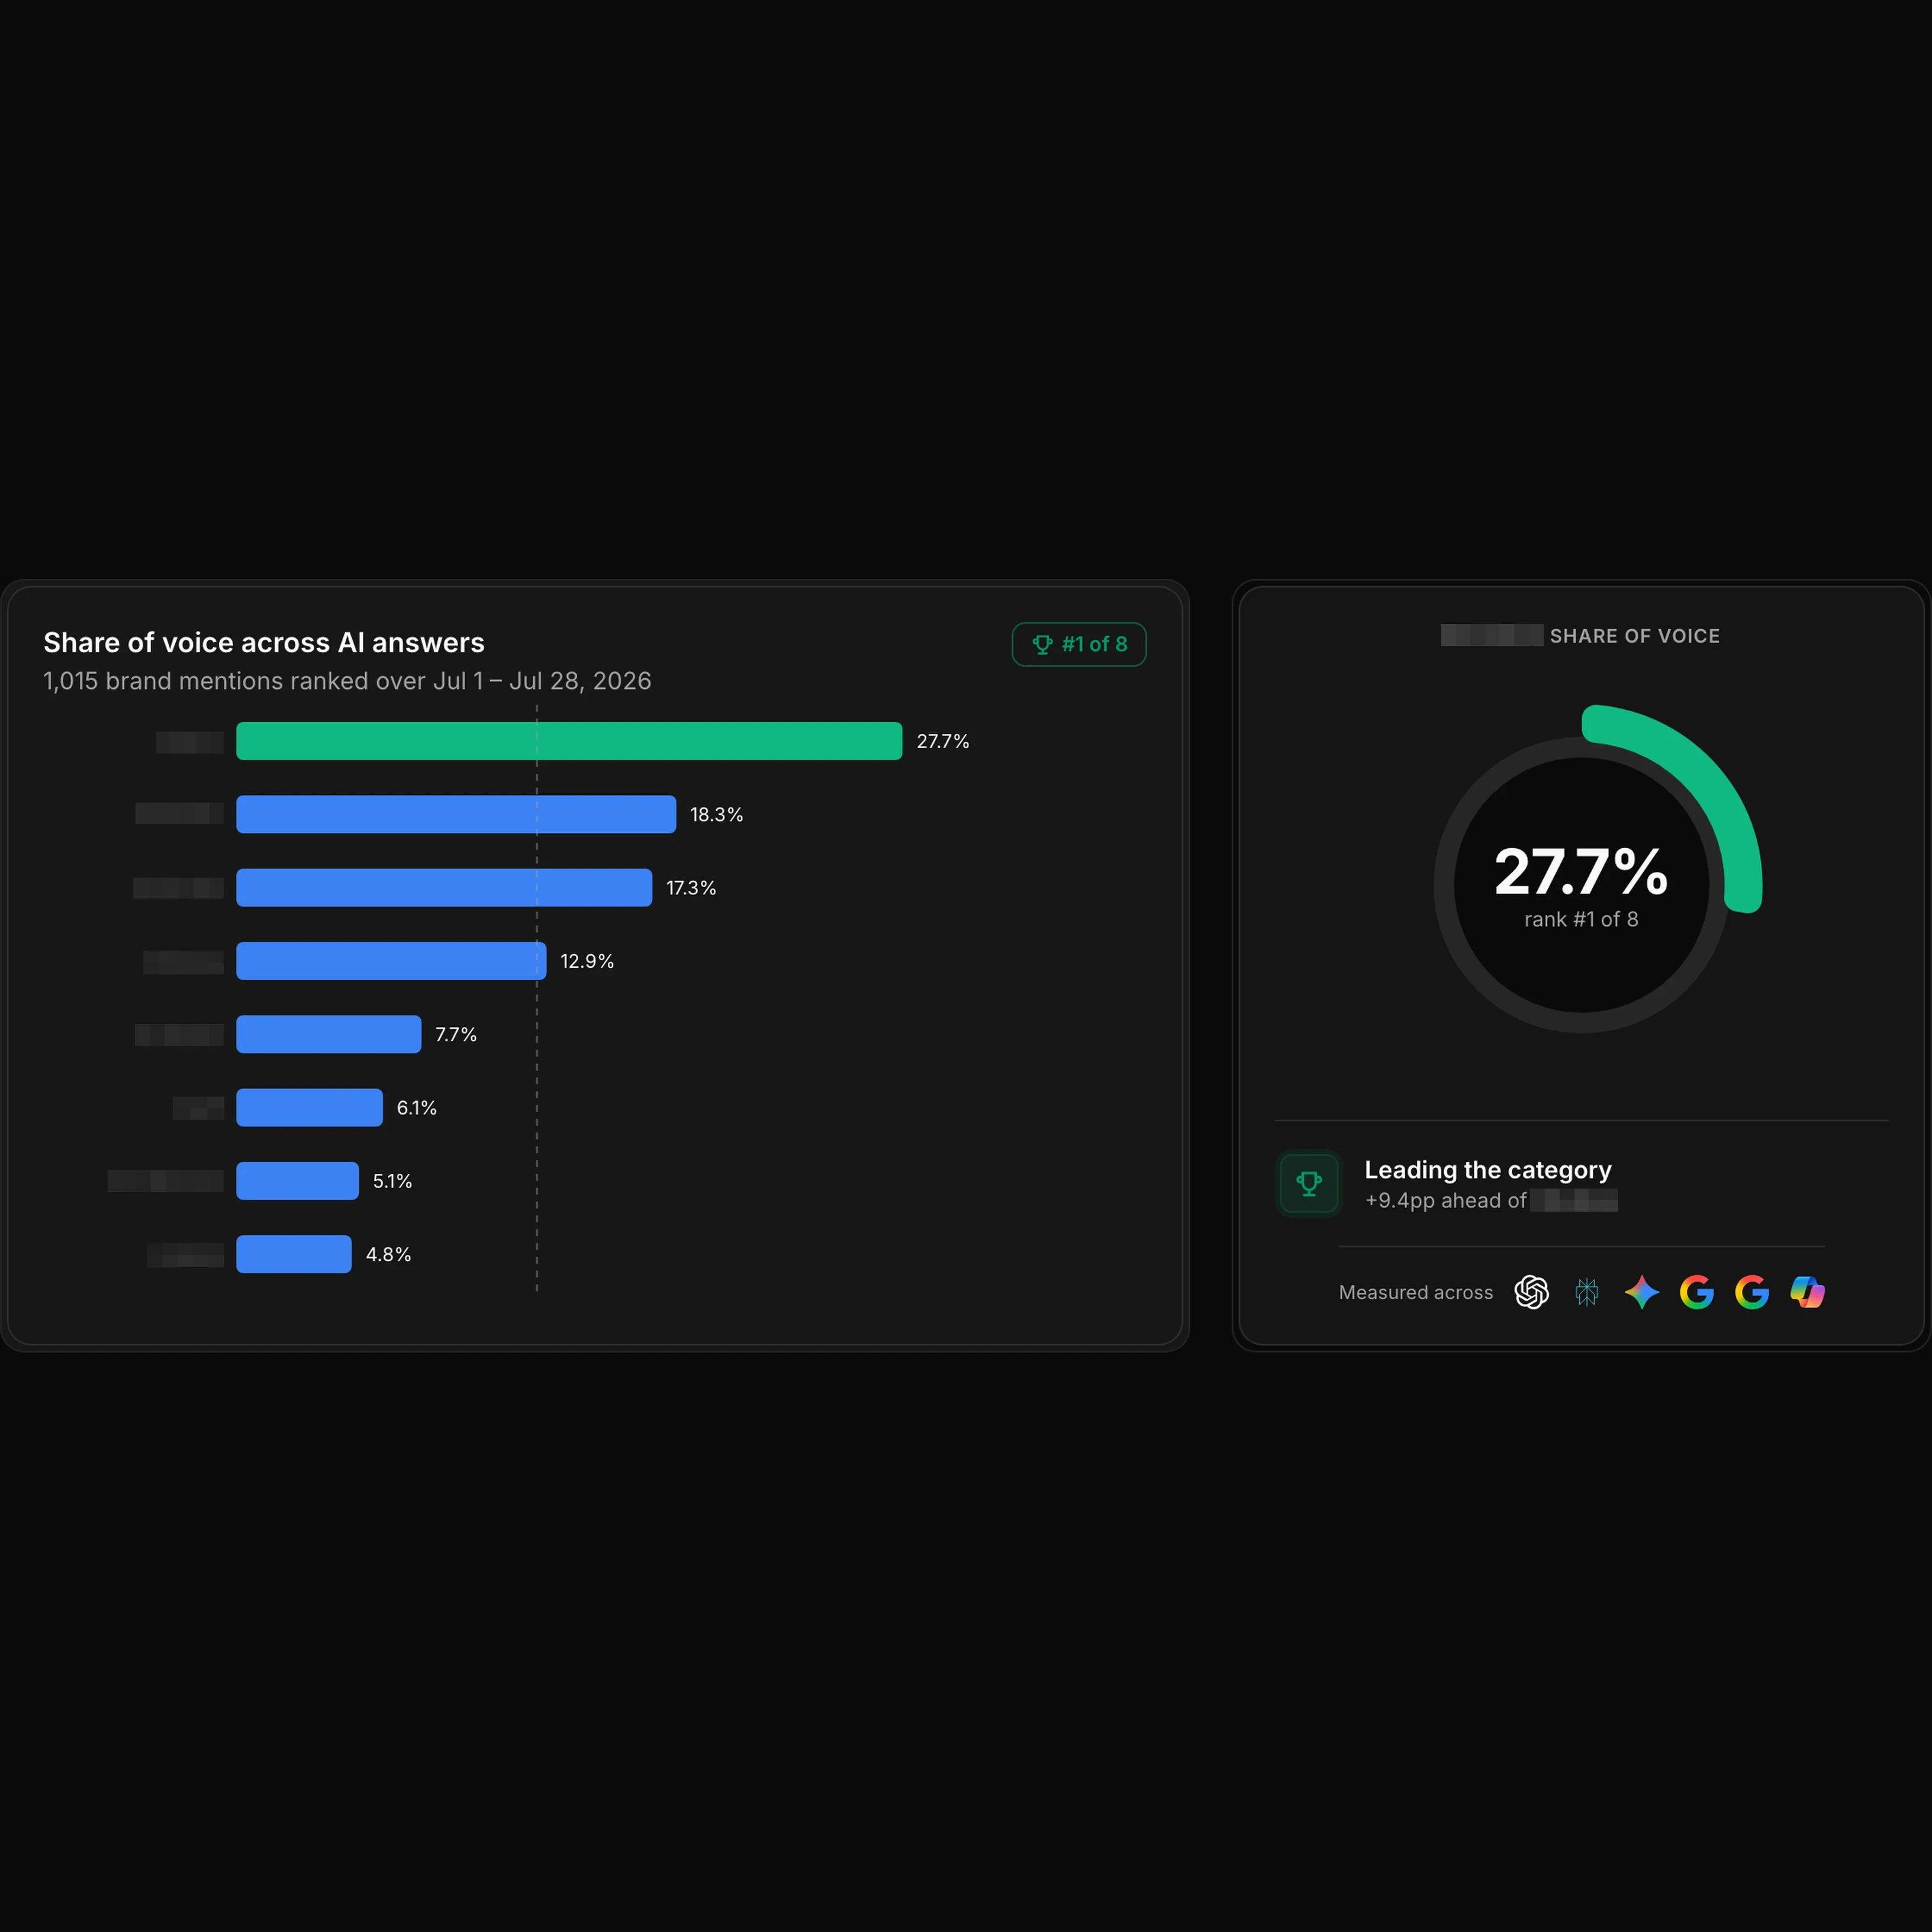
TL;DR: AI share of voice is the share of a category's answer-engine mentions that belongs to your brand: your named cells divided by the named cells of every brand in a competitor set you wrote down before you looked at the results. The arithmetic is trivial and the denominator is the entire job. Count how often a frozen set of buyer prompts, run a fixed number of times across named engines inside dated bounds, writes your brand's name — then divide by the same count for the whole set. Report two numbers rather than one: named share and cited share. Apply no weighting for position or sentiment, accept no published benchmark band, and compare only against your own previous window.
The AI share of voice glossary entry is the one-paragraph summary of the term; this page is the full method behind it — the decisions, the formula and a worked example you can re-run. For what a single answer can and cannot tell you, read mention vs citation. For what to do once the two numbers diverge, read the source gap and conversion gap framework. For where these AI share of voice marketing metrics belong in a monthly client deliverable, read SEO client reporting.
AI share of voice is not advertising share of voice
Classic share of voice has a denominator someone else can count. Spend, impressions, or column inches in a defined market can be checked against invoices and rate cards by a third party, because the market was bought and sold. Nothing like that exists behind an answer engine. There is no register of every question a buyer asked ChatGPT last week, and no engine publishes one.
Search Engine Land's Dan Taylor made this the central objection in June 2026: AI share of voice rests on a hidden denominator, vendors sample a small static subset of prompts and then present the result as an authoritative percentage, and the universe of possible prompts is “effectively infinite” (8 June 2026, read 2026-09-11). He is right, and he stops there — the piece proposes three replacement metrics, share of mentions, share of recommendations and share of narrative, without specifying how to sample any of them.
The objection has a practical answer that is weaker than it sounds and more useful than it looks. You cannot make the denominator complete. You can make it declared. A declared denominator is not representative of all demand and should never be described as such; it is reproducible, which means a client can re-run it, challenge a row, and compare next month to this month without arguing about what changed. That is the only property of this metric that survives a difficult meeting.
How to measure AI share of voice: six decisions you write down first
Every one of these is a knob. Left loose, each one silently moves the percentage. The protocol is to fix all six before the first run and print them beside the number.
| Decision | What you fix | What breaks if you leave it loose |
|---|---|---|
| 1. Brand set | Your brand plus the named competitors, with aliases and product names listed | The denominator changes every time someone new is added, so the trend line is not a trend |
| 2. Prompt set | How many prompts, which question shapes, who wrote them, and the date they were frozen | Rewording prompts between runs produces movement that has nothing to do with the brand |
| 3. Engines | Each engine named: ChatGPT, Perplexity, Gemini, Google AI Overviews, Google AI Mode, Copilot | "Google" is three different surfaces; a vendor row saying "Google" can mean any of them |
| 4. Window | Calendar start and end dates, not "recent" or "last quarter" | Two windows of different lengths are not comparable, and nobody notices in a chart |
| 5. Runs per prompt per engine | A number, n, plus the rule for resolving n runs into one result | A single pass reports sampling noise as a change in visibility |
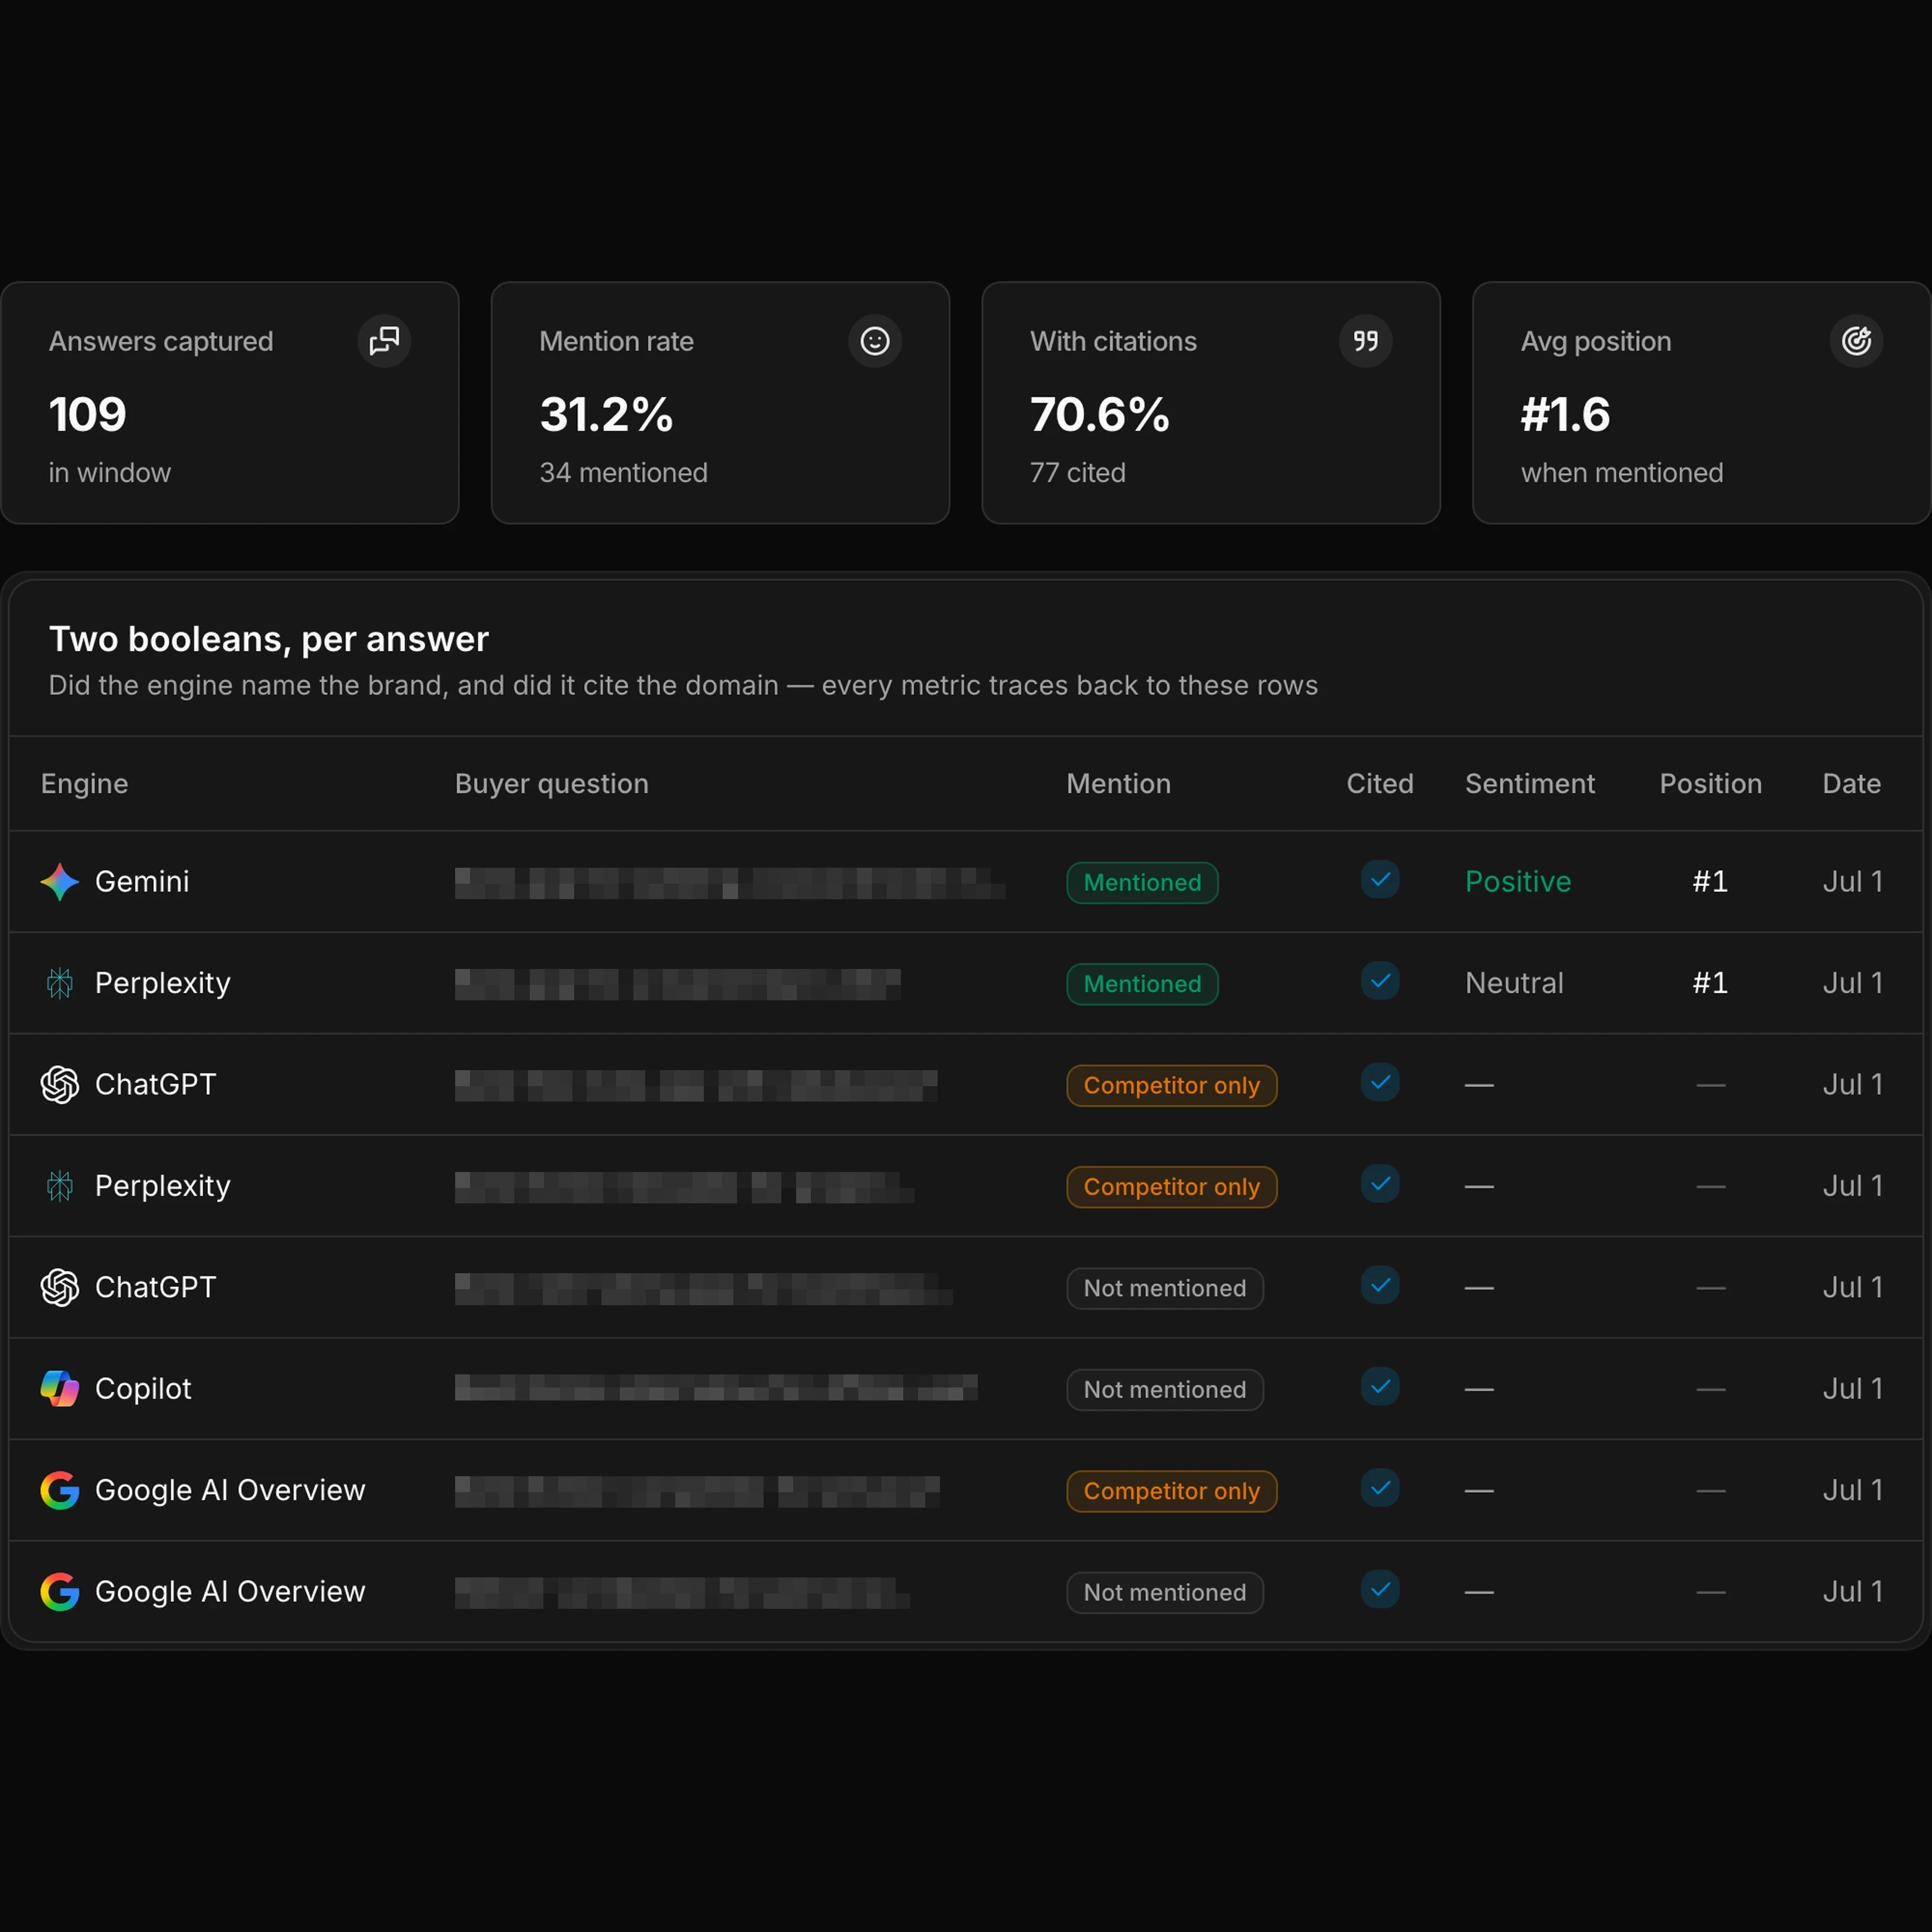
| 6. Mention and citation rules | Named = the brand string appears in the answer text. Cited = the brand's domain appears in the listed sources | "Mention" quietly shifts between any string match and an explicit recommendation |
Decision 5 is the one almost nobody finishes: n, the number of times one prompt is put to one engine before that cell's result is recorded. We read eight pages that publish a method for this metric on 2026-09-11, and two of them ask you to repeat a prompt and combine the runs. Goodie (12 August 2026) says to run each prompt several times in a session and average across the runs, without naming a number; it also recommends two to four competitors and an eight to twelve week trend. OptimizeGEO (3 June 2026) does name one — at least two runs, averaged — but only for ChatGPT. Both say to average. Neither says how a single cell resolves when the runs disagree — averaging a yes/no cell needs a rule for that — and neither counts the disagreements. The rest repeat across days or weeks instead of across runs, or not at all. Geneo (December 2025) asks for daily or weekly batteries reported as medians over a rolling 14 to 28 day range. LLM Pulse (published 5 July 2026, updated 10 August 2026) recommends 30 to 100 prompts, three to five competitors and five models on a weekly cadence. Semrush's guide (updated 17 July 2026) gives the formula and no sampling protocol at all. Alex Birkett (updated 5 August 2026) says tools smooth the variance out by sampling repeatedly, and leaves the count to the tool. Scrunch's how-to (23 February 2026) is a walkthrough of its own tabs and carries a banner saying parts of it may no longer match the product. The Siftly calculator (marked last updated June 2026) takes two counts and returns a percentage.
Decision 3 is worth a second look if your prompt set is short. Engines expand one question into several sub-searches before writing an answer — query fan-out — so a prompt set built from one phrasing per topic samples a narrower slice of the engine's behaviour than the count of prompts suggests.
The formula, and why it has to produce two numbers
Define the cell as the unit: one prompt, on one engine, inside one window, resolved from n runs. A 25-prompt set on three engines is 75 cells.
- Named share of voice = your named cells ÷ named cells summed across the whole brand set × 100
- Cited share of voice = your cited cells ÷ cited cells summed across the whole brand set × 100
Two rules go with it. Aggregate counts, never average percentages across engines — a 20% share on one engine and a 10% share on another do not make 15% unless the denominators happen to match. And note that several brands can be named in one answer, so the sum of named cells across brands is usually larger than the number of cells. This is a share of mentions, not a share of answers, and describing it as "the percentage of answers you appear in" is a different metric with a different denominator.
Naming the two states is common; computing both of them on one competitor denominator is not. Goodie names mention-based and citation-based SOV as two distinct states and reads the gap between them as awareness without authority, then publishes a single formula — brand citations divided by category citations — while the steps underneath count appearances in answers. Birkett draws the same line and declines to call the second one share of voice at all, preferring citation share. LLM Pulse keeps mention rate and citation rate apart, which is more than most, but computes share of voice on mentions alone; its citation rate sits on a total-evaluations denominator, so there is no citation share against a competitor set. Semrush's formula counts mentions. Siftly's calculator takes mentions only.
They are two different failures. Named high and cited low, across the set, is a source gap: the engine repeats your name and sends the reader to a review site for the detail. Cited high and named low is a conversion gap: your content is doing the work and another brand, or no brand, gets the sentence. Average them into one figure and you have deleted the only thing in the report that tells an agency what to do next week, which is why our own reports are evidence, not a score.
How many runs, and why a single pass lies
Generative answers vary between identical runs. That variation is not a measurement error to be smoothed away quietly; it is a property of the thing being measured, and it belongs in the report.
- Set n at three or more runs per prompt per engine, inside the same window.
- Resolve the cell by majority: a brand counts as named when at least two of three runs name it.
- Count the unstable cells separately — the ones where a brand appeared in exactly one run of three — and print that count beside the percentage. A share of voice whose numerator moves by a third on re-resolution does not deserve a decimal place.
- Hold a few control prompts constant across every window, so an engine-side shift can be told apart from a brand-side one. This idea comes from Geneo's best-practices page, and it is the part of that page worth adopting.
- Compare medians across windows, not single runs against single runs.
What we do not adopt from that page is its weighting. Its example formula multiplies mentions by a position weight (first citation 1.0, second 0.7, third 0.5, fourth and beyond 0.3) and a sentiment weight (positive 1.2, neutral 1.0, negative 0.8). LLM Pulse publishes a related idea as an AI visibility score: the sum of 100 divided by mention position, over total evaluations. Geneo labels both of its weight sets as examples to calibrate; LLM Pulse prints its position-weighted score in a formula table beside mention rate and citation rate, not as an example. We decline both, for two reasons that are boundaries rather than preferences. A synthesised answer has no ranked result set, so "position" is a property of one engine's layout on one day, not of the brand. And we do not compute sentiment at all — not cautiously, not as a tiebreak — so a sentiment coefficient would be a number we made up.
The cost of n=3 is real and worth stating before anyone promises it to a client. Our free AI visibility checker generates 25 prompts and a 75-row scoring sheet for ChatGPT, Perplexity and Gemini; the tool page puts a full manual pass at roughly 90 minutes. At three runs per cell that is 225 answers and something closer to four and a half hours, for one brand, for one week. Three runs is where measuring share of voice by hand stops scaling across a roster.
Benchmarking against competitors without cherry-picking
Competitor benchmarking is the same calculation with a wider brand set, which is exactly why the brand set has to be chosen before the results are visible.
- Derive the set from the answers, not the pitch deck. Run the prompt set once, list every brand named in more than one cell, and pick from that list using a rule you write down — the top four by named cells, say, or every brand the client's sales team loses deals to.
- Freeze it for the quarter. Adding a brand mid-series changes the denominator for every prior week. If you must change it, annotate the break and restate the earlier windows on the new set, or start a new series.
- Set size is a judgement call, not a standard. Three to five competitors (LLM Pulse), two to four (Goodie), six to eight (Birkett). All three are defensible, which is the point. Changing the number after you have seen your own is not.
- Publish the set with the number. A share of voice without its brand set printed next to it cannot be checked by the client and cannot be compared to anything, including your own last report.
Here is why that last point is not pedantry.
A worked example
Fervano is the fictional espresso brand we use in product demos; Moltara, Crentis and Vaudel are invented competitors. No real brand or client data appears below.
Declared denominator: brand set Fervano, Moltara, Crentis, Vaudel · prompt set 25 category and comparison prompts, frozen 2026-09-01 · engines ChatGPT, Perplexity, Gemini · window 2026-09-01 to 2026-09-07 · n = 3 runs per prompt per engine, majority rule · named = brand string in the answer text, cited = brand domain in the listed sources · 75 cells, 225 delivered answers.
| Brand | Named cells (of 75) | Cited cells (of 75) | Named SoV | Cited SoV |
|---|---|---|---|---|
| Fervano | 21 | 7 | 25.0% | 14.6% |
| Moltara | 33 | 21 | 39.3% | 43.8% |
| Crentis | 24 | 15 | 28.6% | 31.2% |
| Vaudel | 6 | 5 | 7.1% | 10.4% |
| Total | 84 | 48 | 100% | 100% |
Cited shares are rounded to one decimal, and Crentis sits exactly on the halfway point: 15 of 48 is 31.25%, shown here as 31.2% so the column still reads 100.0. The counts, not the percentages, are the thing a client should check.
Three things to read off it. Named cells total 84 across 75 cells, because answers name several brands at once. Fervano's named share is well above its cited share, which is a source gap across the set — the engines say the name and hand the sourcing to somebody else. And Fervano was named in exactly one run of three in a further seven cells; resolving those the other way moves the numerator from 21 to 28 and the denominator from 84 to 91, taking named share from 25.0% to 30.8% — 5.8 points — before any competitor's instability is counted. That is the honest error bar. Geneo is the only one of the eight pages that asks for a range around the number at all, and its range is the spread across fourteen to twenty-eight days of re-running; this one is the spread inside a single window.
Now hold the week's answers completely still and change only the brand set:
| Brand set | Named cells in denominator | Fervano named SoV |
|---|---|---|
| As declared (four brands) | 84 | 25.0% |
| Drop Vaudel, the weakest | 78 | 26.9% |
| Add a fifth brand named in 19 cells | 103 | 20.4% |
| Fervano versus Moltara only | 54 | 38.9% |
Same engines, same prompts, same week, same answers: 20.4% to 38.9%. Nothing about the brand changed. This is the hidden denominator in one table, and it is the reason the brand set belongs in the report rather than in a settings screen. Birkett makes the parallel point about the other half of the denominator — choose different prompts and you move your own baseline — which is why both lists get frozen and printed.
What we will not put in the number
| Practice | Where it is published | Why we leave it out |
|---|---|---|
| Position weighting | Geneo's example weights; LLM Pulse's position-based visibility score; Goodie's step 3 records where in the response the brand appeared | A synthesised answer has no ranked result set, so position measures layout, not the brand |
| Sentiment weighting | Geneo's example coefficients | We do not compute sentiment on answers, so any coefficient would be invented |
| Benchmark bands | The Siftly calculator reads out below 20%, 20-40%, 40-60% and above 60% bands; Goodie's FAQ puts category leadership at 15-20% in fragmented markets and 40-50%+ where two or three players dominate | No dataset behind the bands is published on the page, and the table above shows the number moves with the brand set anyway |
| A category average to beat | Goodie's page carries a 17.2% average mention rate, attributed in its FAQ to AthenaHQ's State of AI Search 2026 | It is one vendor's figure from a prompt set and method we have not examined, so it is not a target for yours and we do not put it in a client report |
| One blended visibility score | Common across the category | It merges two failures that need different fixes, and the report loses the instruction it was supposed to carry |
| Cause and effect | Implied by most before-and-after charts | We can show a change across two dated windows; we cannot show that a fix produced it |
Competitor pages in this section were read on 2026-09-11. Products change; re-check before quoting any of it to a client.
When share of voice is the wrong metric
It is a relative measure, so it fails in exactly the places where relative measures fail.
A brand with almost no third-party coverage. Every cell comes back negative, the share is zero, and the number tells you nothing you did not already know. Coverage is the work; measurement comes after.
Small denominators. Below roughly 30 named cells across the whole brand set, one flipped answer moves the percentage by several points. Report counts and let the client see how few they are.
One engine. A share of voice from ChatGPT alone describes ChatGPT. It is a legitimate number if labelled as one, and misleading the moment it is called AI share of voice.
And when what you want is a higher number. Measuring does not move it, and nothing on this page claims to. What moves it is input-side work — the pages, the third-party coverage and the comparisons an engine can read — and that is the agency's job, not the measurement's. We can show that a number changed between two dated windows and open every answer behind it; we cannot show that a particular change caused it, and we do not promise to change what an engine says about anyone.
And where we do not fit. Jincove is built for agencies running this across a roster, not for a single brand watching itself — a single brand pays for machinery it will not use. Teams who want one headline percentage will find our reports deliberately uncomfortable, because we do not produce one. Our free sample audit covers three engines, not six. White-label client reports are coming soon rather than shipped.
Questions buyers ask
Is there a standard formula for AI share of voice?
There is a standard arithmetic and no standard method. Every page that gives a formula divides one total by a larger total and multiplies by 100, and which two totals is not settled: Goodie and OptimizeGEO use brand citations over category citations, Semrush mentions over category mentions, Birkett responses naming the brand over every response in the prompt set — no competitor in that denominator. What else differs, invisibly, is the prompt set, the engine list, the window, the number of runs, and what counts as a mention. Two vendors can hand the same brand percentages ten points apart, both arithmetically correct. That is why the six decisions above belong printed beside the figure: the formula is not the method. Of the eight pages we read on how to measure share of voice in AI search, exactly one names a number of runs, and only for one engine.
What is a good AI share of voice?
There is no defensible answer, and anyone publishing bands is telling you about their own sample rather than your category. The worked example above moves the same brand from 20.4% to 38.9% by changing nothing but the list of competitors, which is enough to disqualify any absolute target. The comparison that survives scrutiny is your own previous window on an unchanged denominator, reported alongside your competitors' movement in the same window. If a competitor gained four points while you gained two, that is a finding. "You are at 25%" is not.
Should a mention inside the cited sources count as a mention?
Keep them in separate columns. Named means the brand string appears in the answer a person reads; cited means the domain appears in the sources. A brand named in a linked page but not in the answer text has been read by nobody, and folding it into the mention count inflates the number that clients quote most often. Score both, report both, and if the two diverge you have located the specific problem to work on rather than a percentage to worry about.
How often should the prompt set re-run?
For a manual pass, weekly and without gaps beats daily with holes — an unbroken line reads as a trend, while two skipped weeks turn the same chart into an anecdote. Daily runs mostly buy variance, because answers move day to day for reasons unrelated to the brand. Jincove's monitoring runs on a schedule set per plan. Whatever the cadence, do not change it mid-series and do not change the prompt set mid-series; if you must, annotate the date so the step in the chart has a cause written next to it.
Can I compare my number to a competitor's published share of voice?
No, and this is the most common way these reports get embarrassed. A published figure comes from that company's prompt set, engine list, window, run count and mention rule, none of which match yours. Their 40% and your 25% are measurements of different things, in the same way two agencies' "visibility scores" are. The same applies to category averages quoted in vendor blog posts: they come from someone else's sample, on someone else's prompts, and being above or below one says nothing about your category. Compare within one method or not at all, never merge two vendors' figures into a single client chart, and if a client arrives holding a competitor's published number, the useful move is to run that competitor through your own denominator rather than argue about theirs.
Do I need a tool for this?
Not to start. A spreadsheet, 25 prompts and three engines gets you a first defensible number in an afternoon, and running it by hand once is the only way to know what any tool is approximating. Tooling earns its place at roughly three clients, or the first time a missed re-run costs a retainer rather than an evening. Its real job is not the arithmetic, which a spreadsheet does perfectly well, but keeping the six decisions frozen between windows and storing the answers behind every count, so a number can still be opened and read months later when a client asks what it was based on. How many months is a question to put in writing to any vendor, us included: we do not publish a retention figure today.
See it on one of your own clients first
Before a share-of-voice line goes into a retainer, see what one measurement window actually yields. Ask us for a free sample audit with a brand, a URL and an email; the questions your buyers actually type get put to ChatGPT, Perplexity and Gemini by hand rather than by a pipeline, and two working days later you have the raw answers, the sources each one cited, and the split between being named in the prose and only being cited underneath. Nothing to pay, no account. If you would rather run the first pass yourself, the AI visibility checker builds the prompt set and the scoring sheet in your browser, and nothing leaves the page.
Related blogs
Related Post
Expand your knowledge with these hand-picked posts.

How to Track Brand Mentions in ChatGPT in 2026: The Agency Method
ChatGPT has no Search Console - no impressions, no analytics, no export. Here is the method agencies use to track brand mentions across ChatGPT and the other answer engines without trusting a black-box score, and why "citations" and "mentions" are two different numbers.
Gan Liu

Best AI Visibility Tools for Agencies in 2026: An Honest Shortlist
Most "best GEO tool" roundups rank on engine count. Agencies buy on a different axis - client roster, white-label, and evidence you can hand a client. Here is the honest shortlist, what each tool is actually best at, and the three questions that decide it.
Gan Liu
How to Track Brand Mentions in Perplexity in 2026: The Agency Method
Perplexity shows numbered citations and a Sources list under every answer. The agency method for reading brand mention vs citation off it - no black-box score.
Gan Liu
See what AI says. Then fix it.
Send one brand. Get the answers, the sources, and the first gaps worth fixing.
No card. No call. No catch. Reply in 2 business days.